# Track bot and workflow executions on Tulip
Under Operations, Execution History one can view the executions of all the bots and workflows in the system.
The user can apply filters on ID, Name, Description, Status, User and Duration.
The different statuses are
- Queued
- Running
- Successful
- Failed
- Obsolete
- Received
- Awaiting User Inputs
# Process View
Select an execution, click on it. You will be able to see the Process View. The process view expands to show the execution in an easily decipherable format. You can view the different bots and other components like user tasks, etc that make up the execution in the order that they were designed. You also have a visibility on the type of bots that make up the execution. By following the green dots, you can view the flow the execution has taken. The numbers on the green dots denote the number of times, the execution traversed through that particular point.
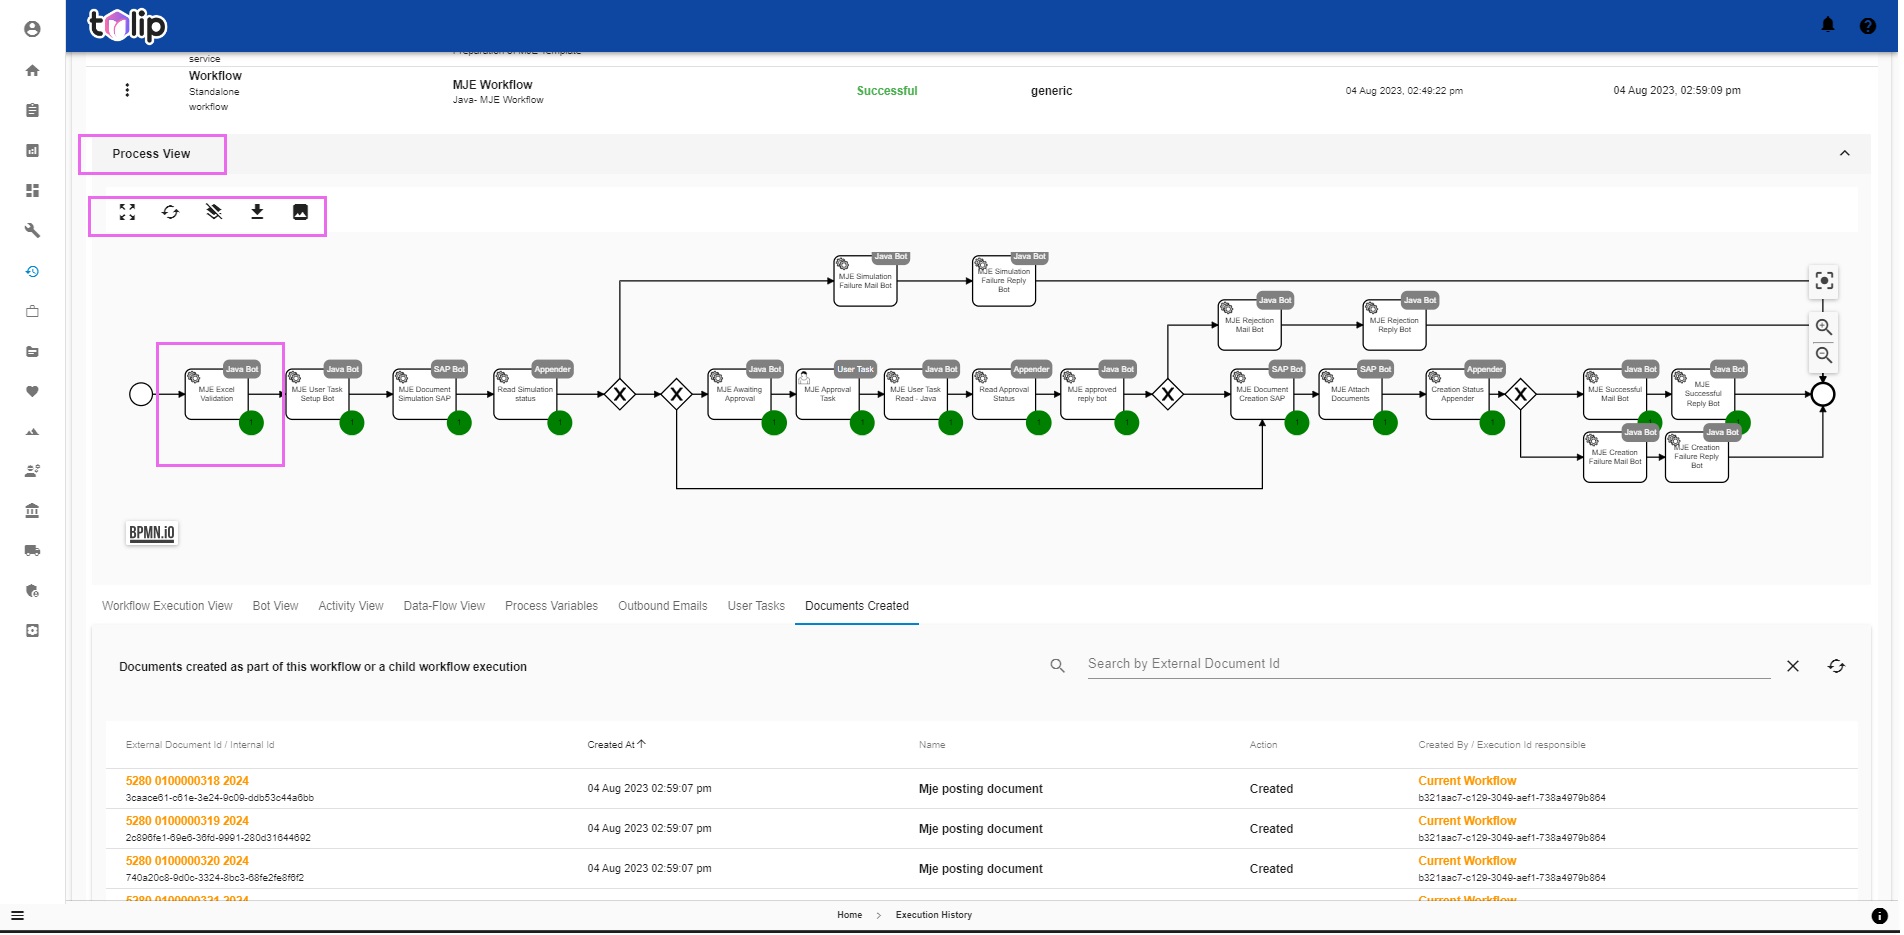
PS: You may use the buttons highlighted to expand, refresh, discard overlays, download the process views. Feel free to play about the buttons to see for yourselves.
By clicking on any point in the execution, you will be able to view the Activity details of that particular bot. Read here
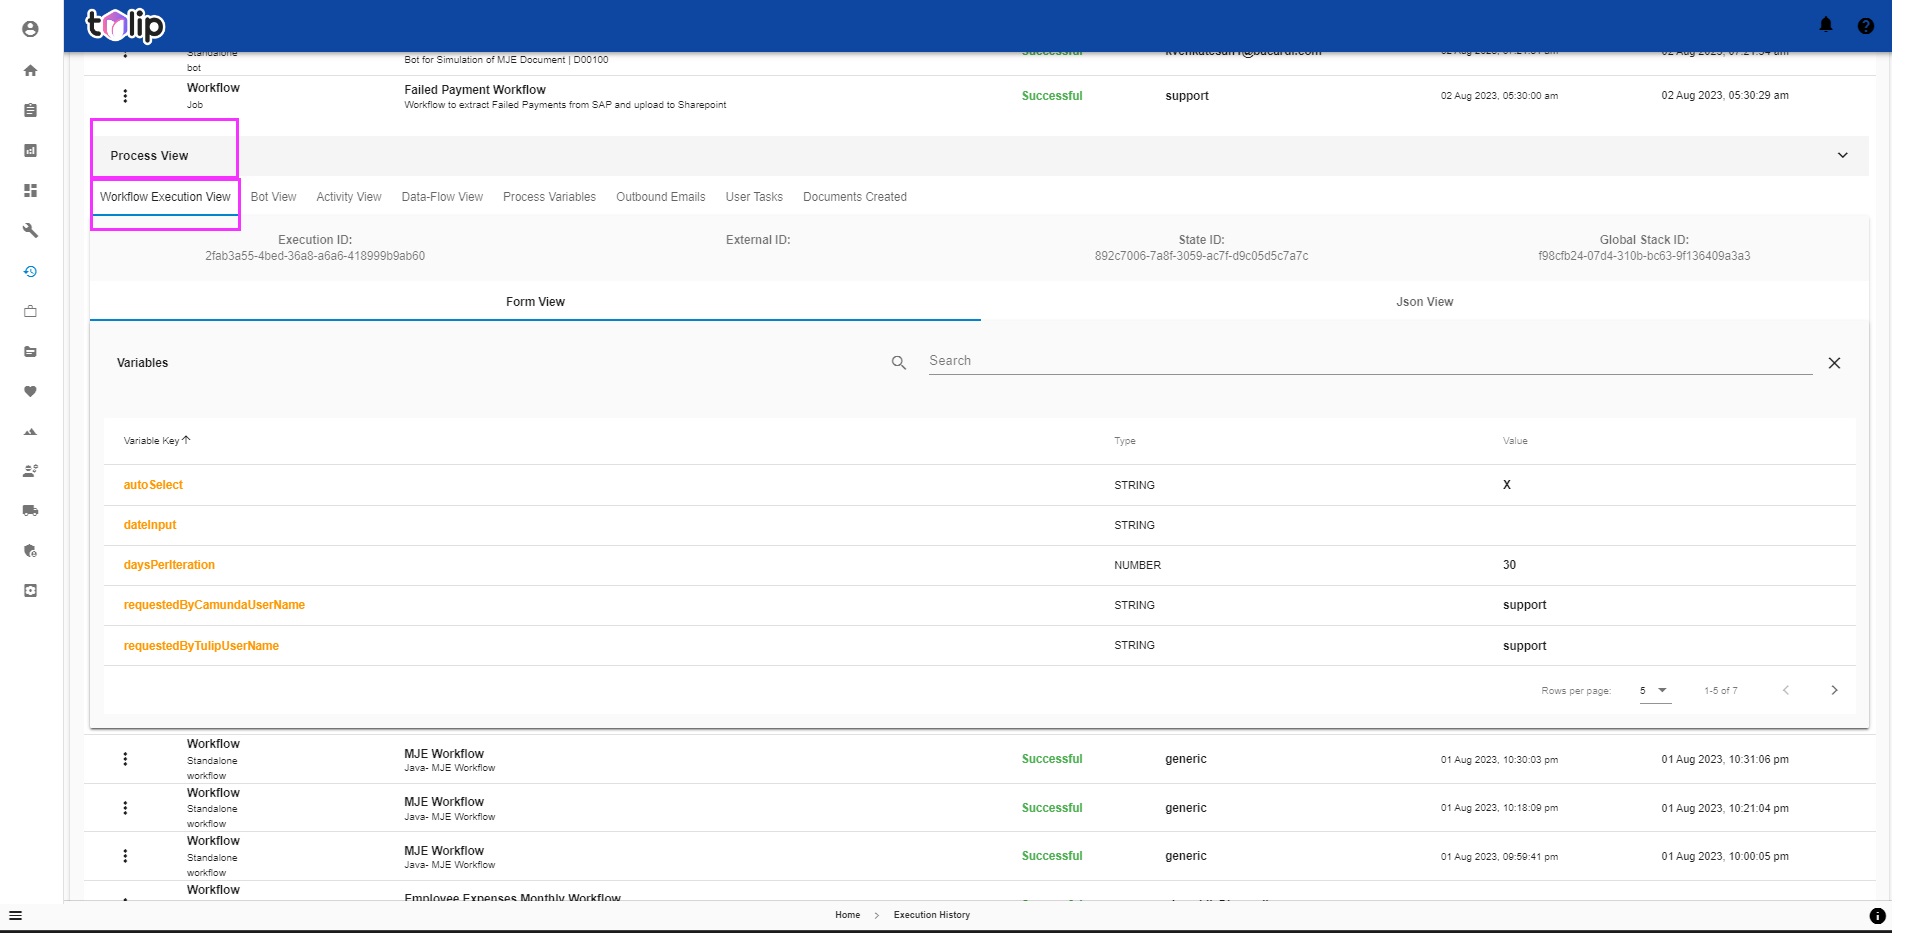
# Workflow Execution View
Underneath the Process View, you can view some sub-menus. Each caters to a different view of the same execution. Clicking on Workflow Execution View, you get to view the Execution Id and the different variables involved in the execution. As per your convenience, you can select the Form view or the Json view. Please note that this list is paginated.
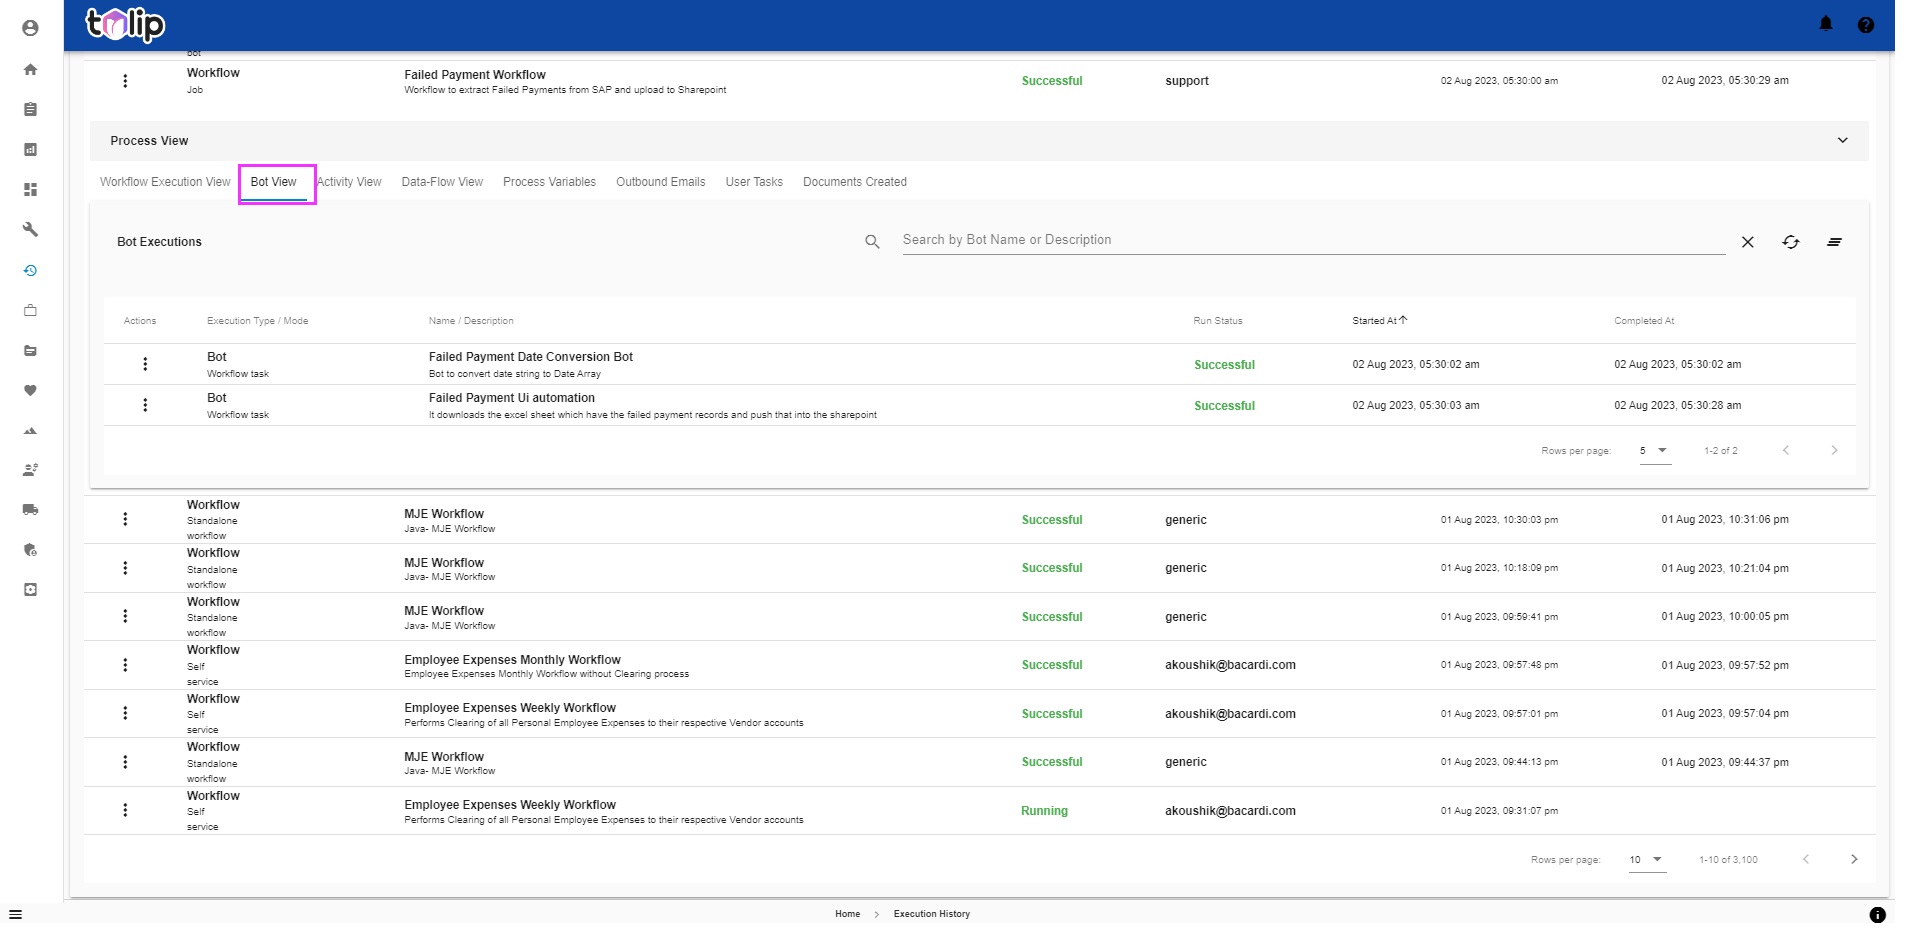
# Bot View
The next view is the Bot View. Here is where you get to see the different bots as part of this execution in the sequence they were executed and the individual resulting statuses of each bot.
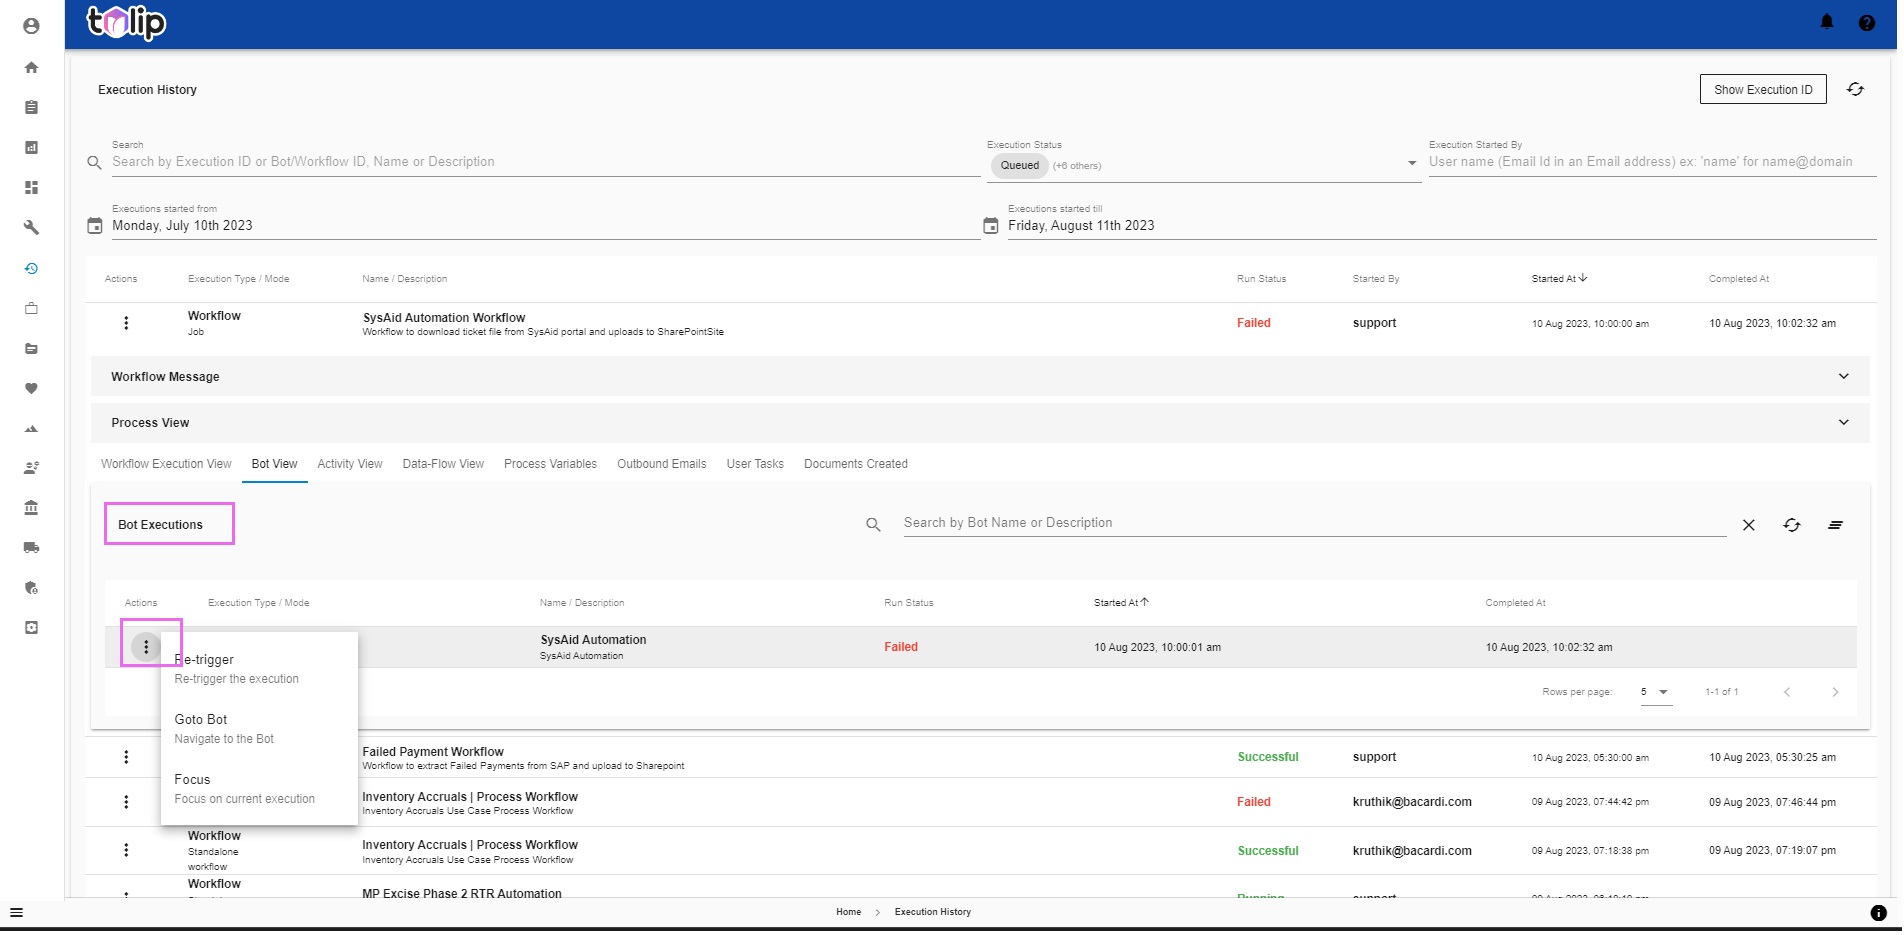
You may click on the three dots on any bot to see what actions are permissible on the bot. You can do a retrigger on a failed bot if you have the necessary Roles and privileges. You can Focus on a bot. Or Goto Bot to view the bot configurations.
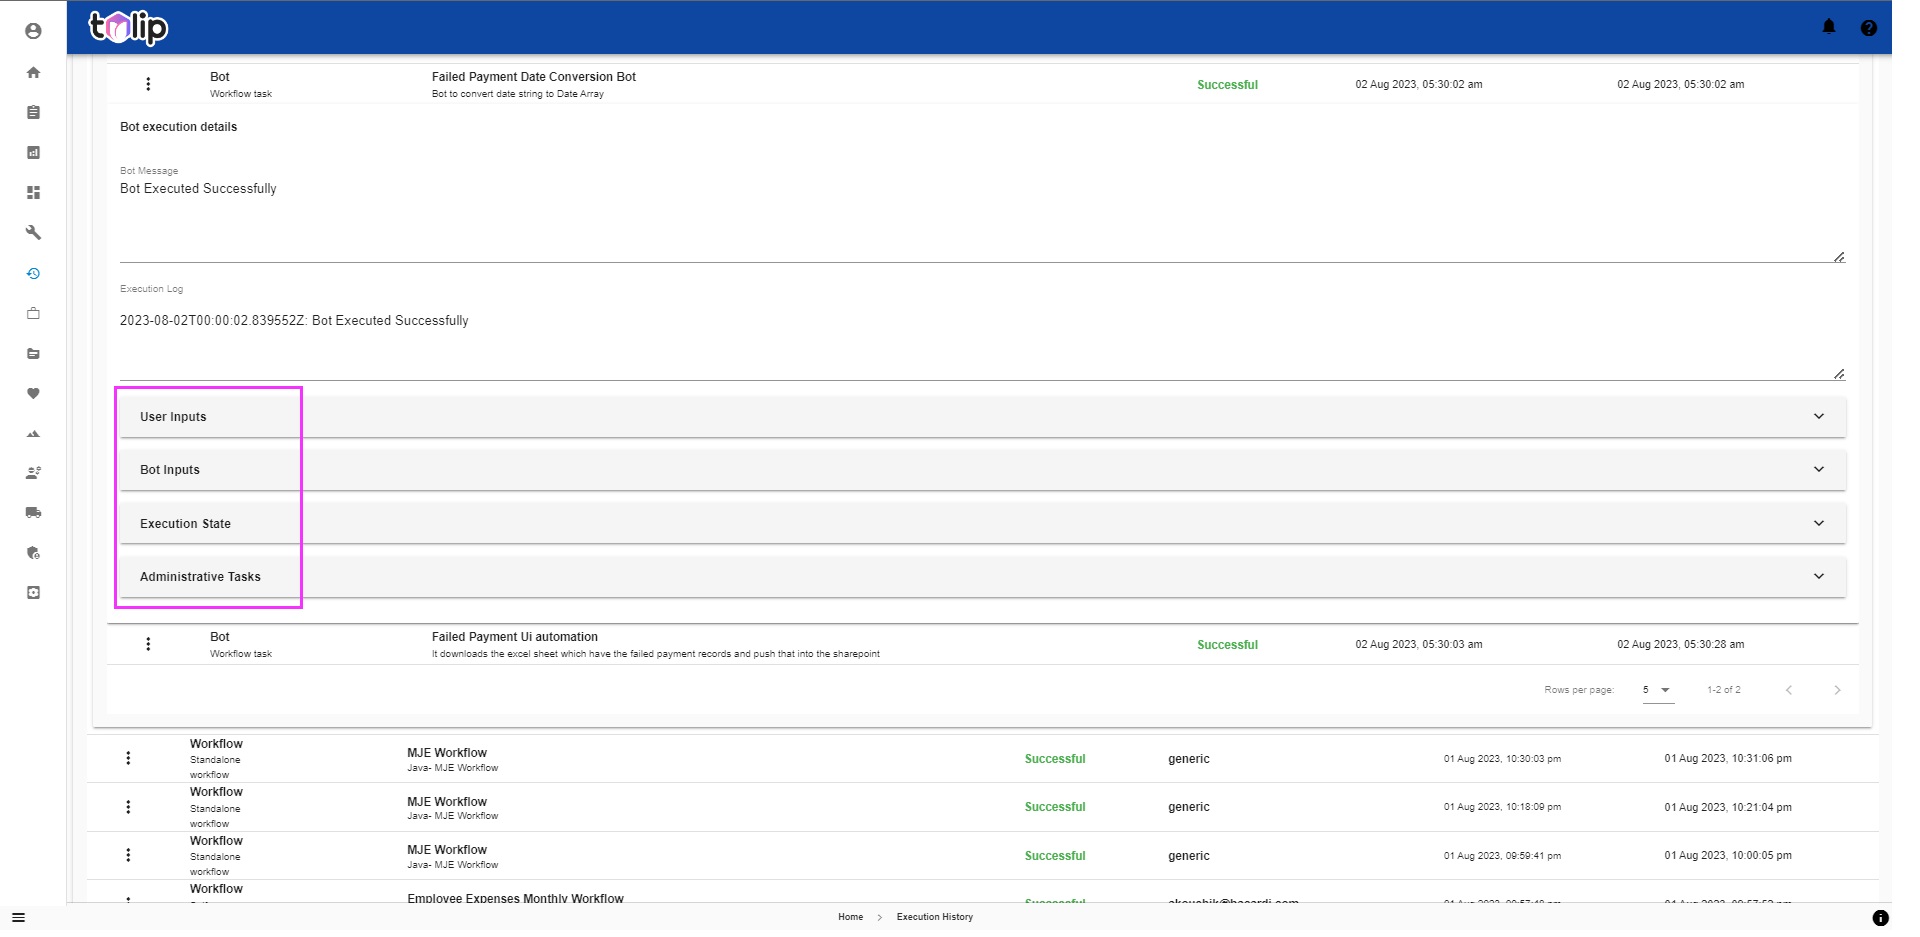
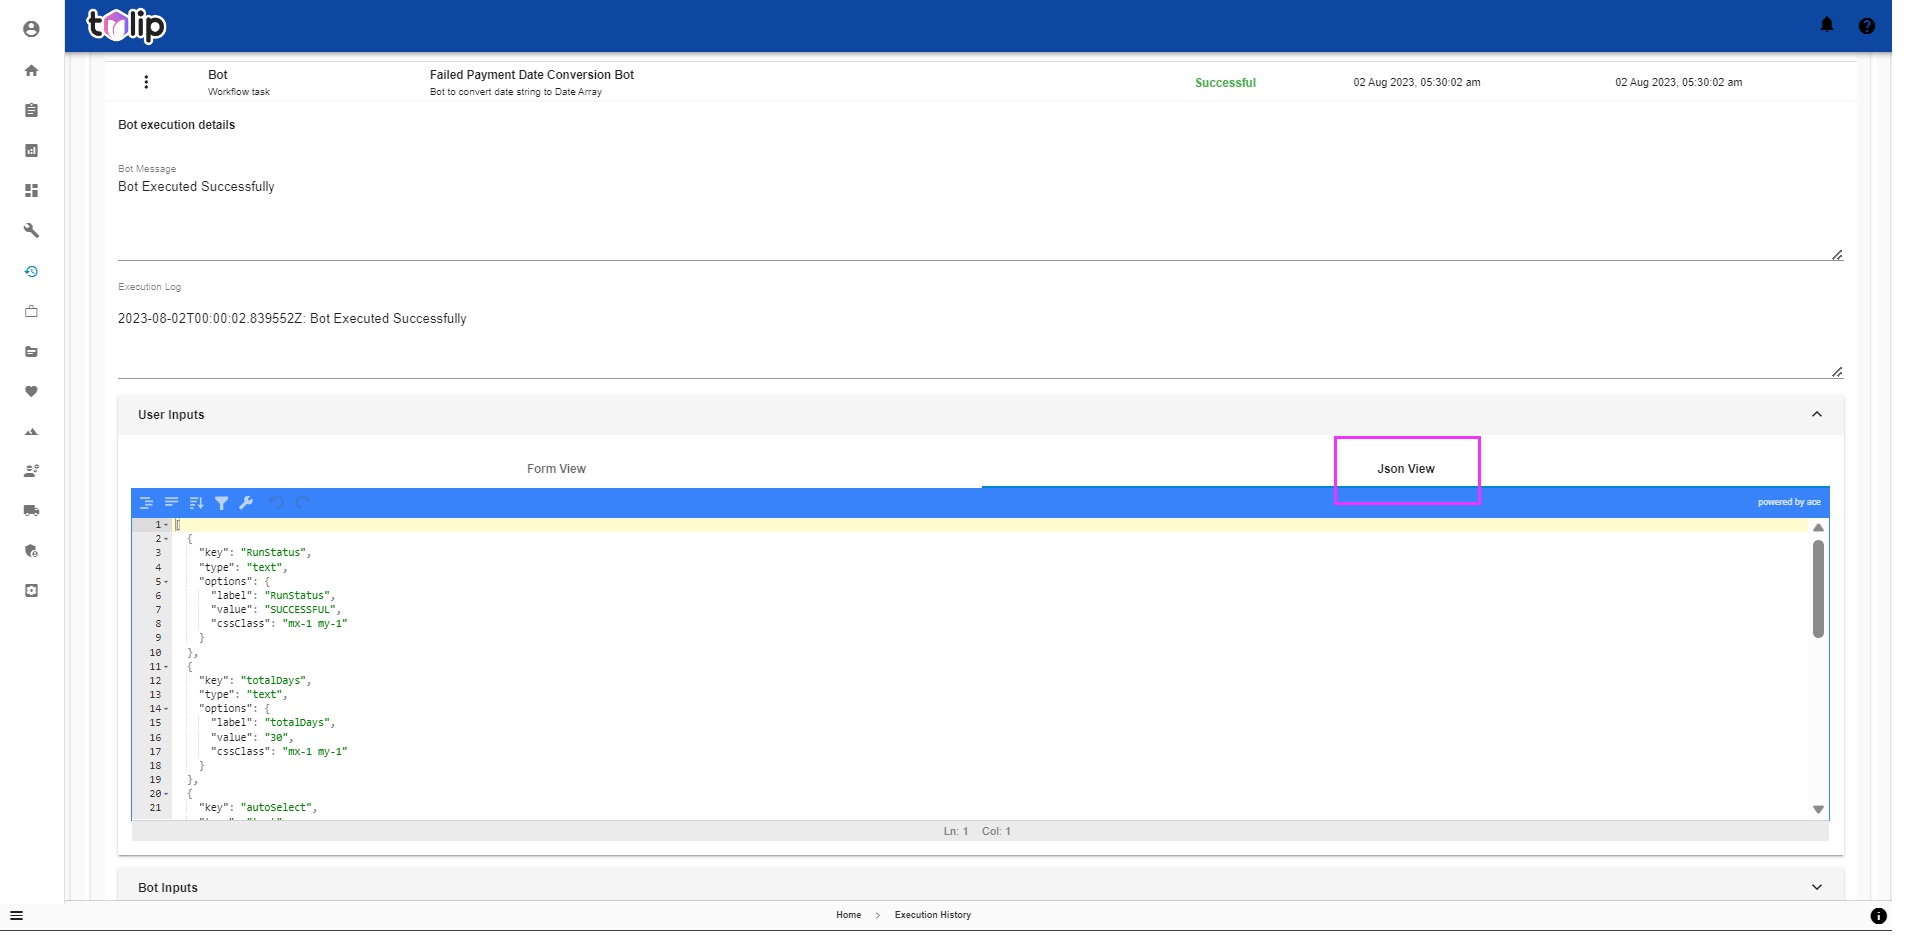
Clicking on any bot here opens up the Bot Message along with the Execution Log and 4 other parameters - the User Inputs, the Bot Inputs, the Execution State and Administrative Tasks. This section displays the message as a result of that individual bot's execution. If there was an error or an issue, this is where the bot informs you of the same.
The User Inputs displays the user input variables in both form view and json view. You can use this area to identify what kind of input values were passed to the bot. In short, this is the user provided input values to the bot.
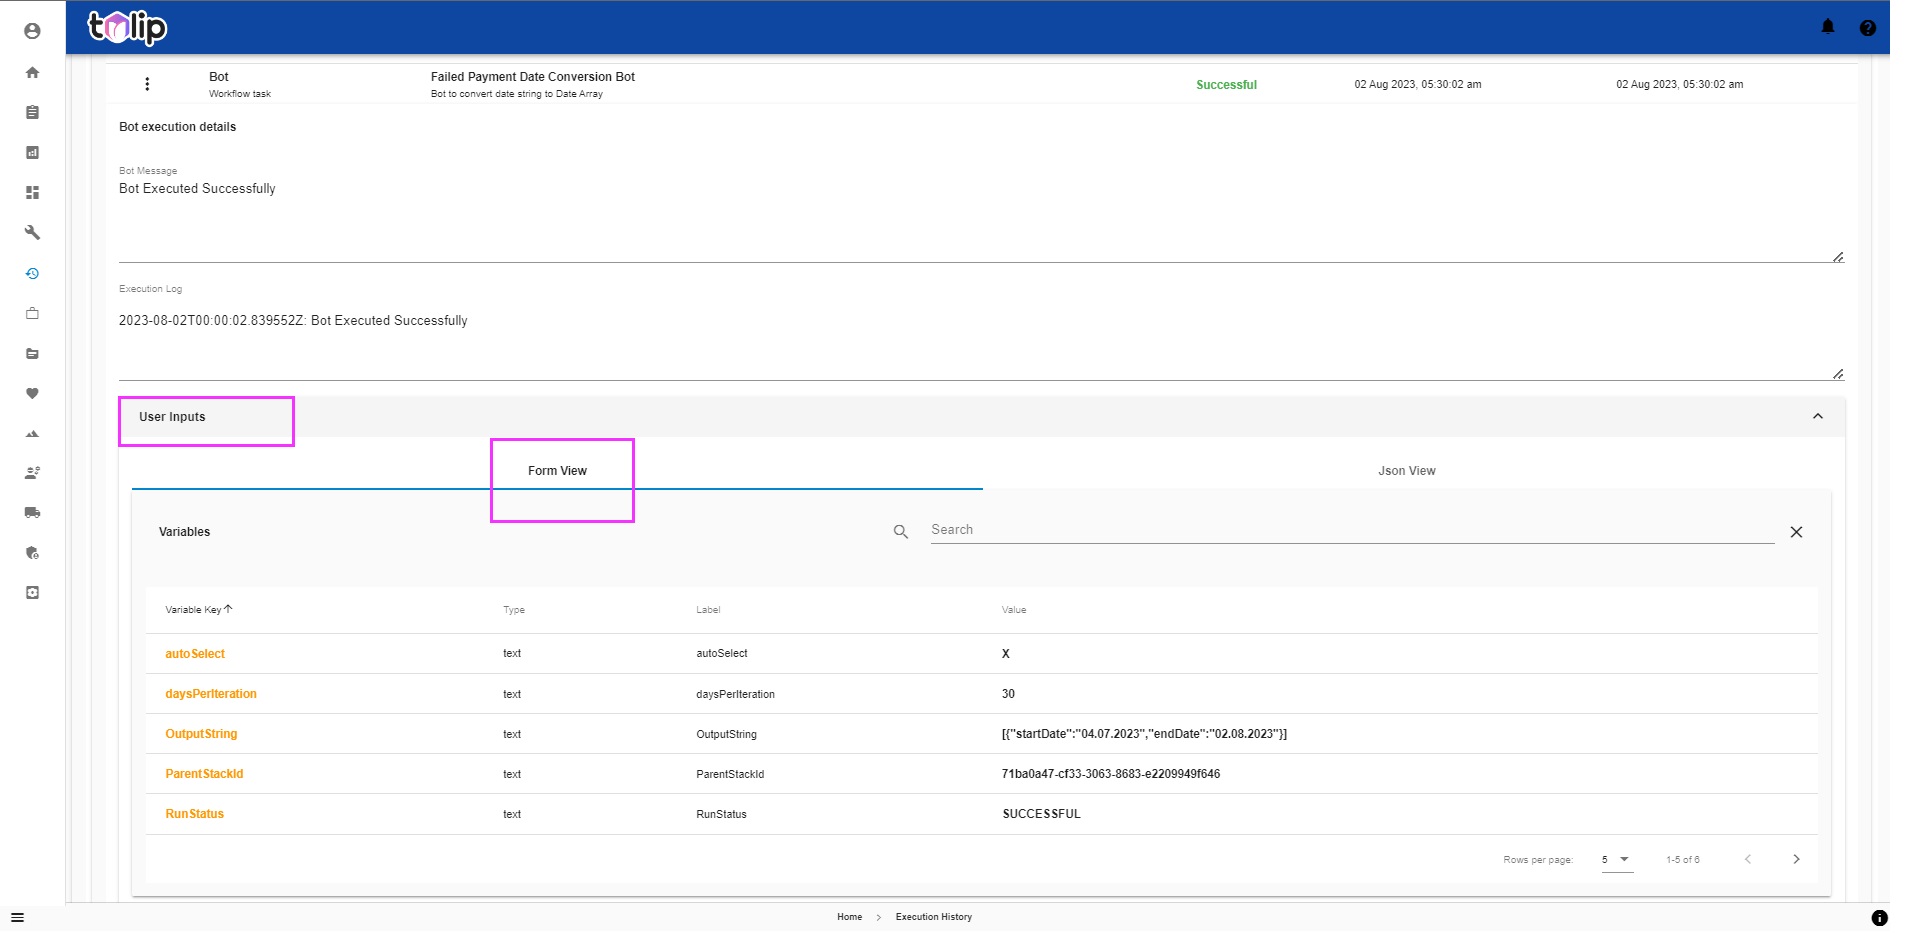
The json view is specifically for developers who prefer to view this section as code rather than a form/table.
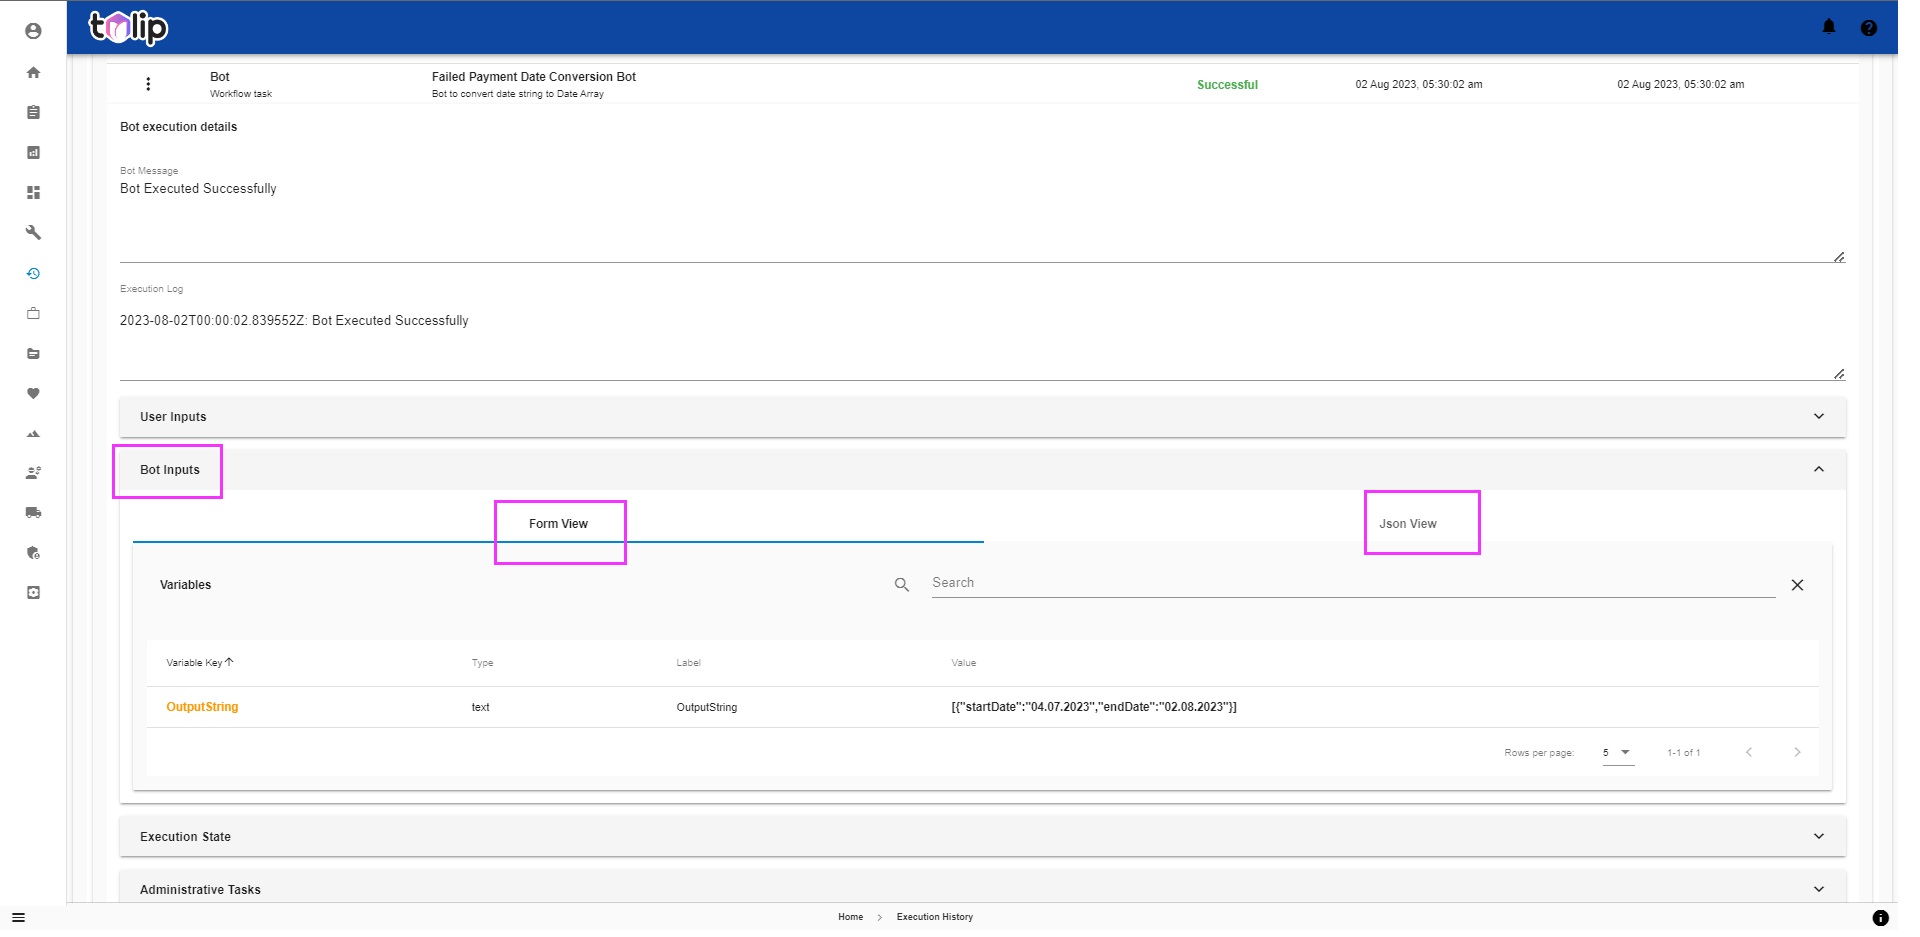
The next is the Bot Inputs. As in with User Inputs, you get to view the variables in both form view and json view. This is where you get to view the exact variables taken by the bot as input. In the flow of execution, one bot passes on vales to the next bot and this section is where you can find that.
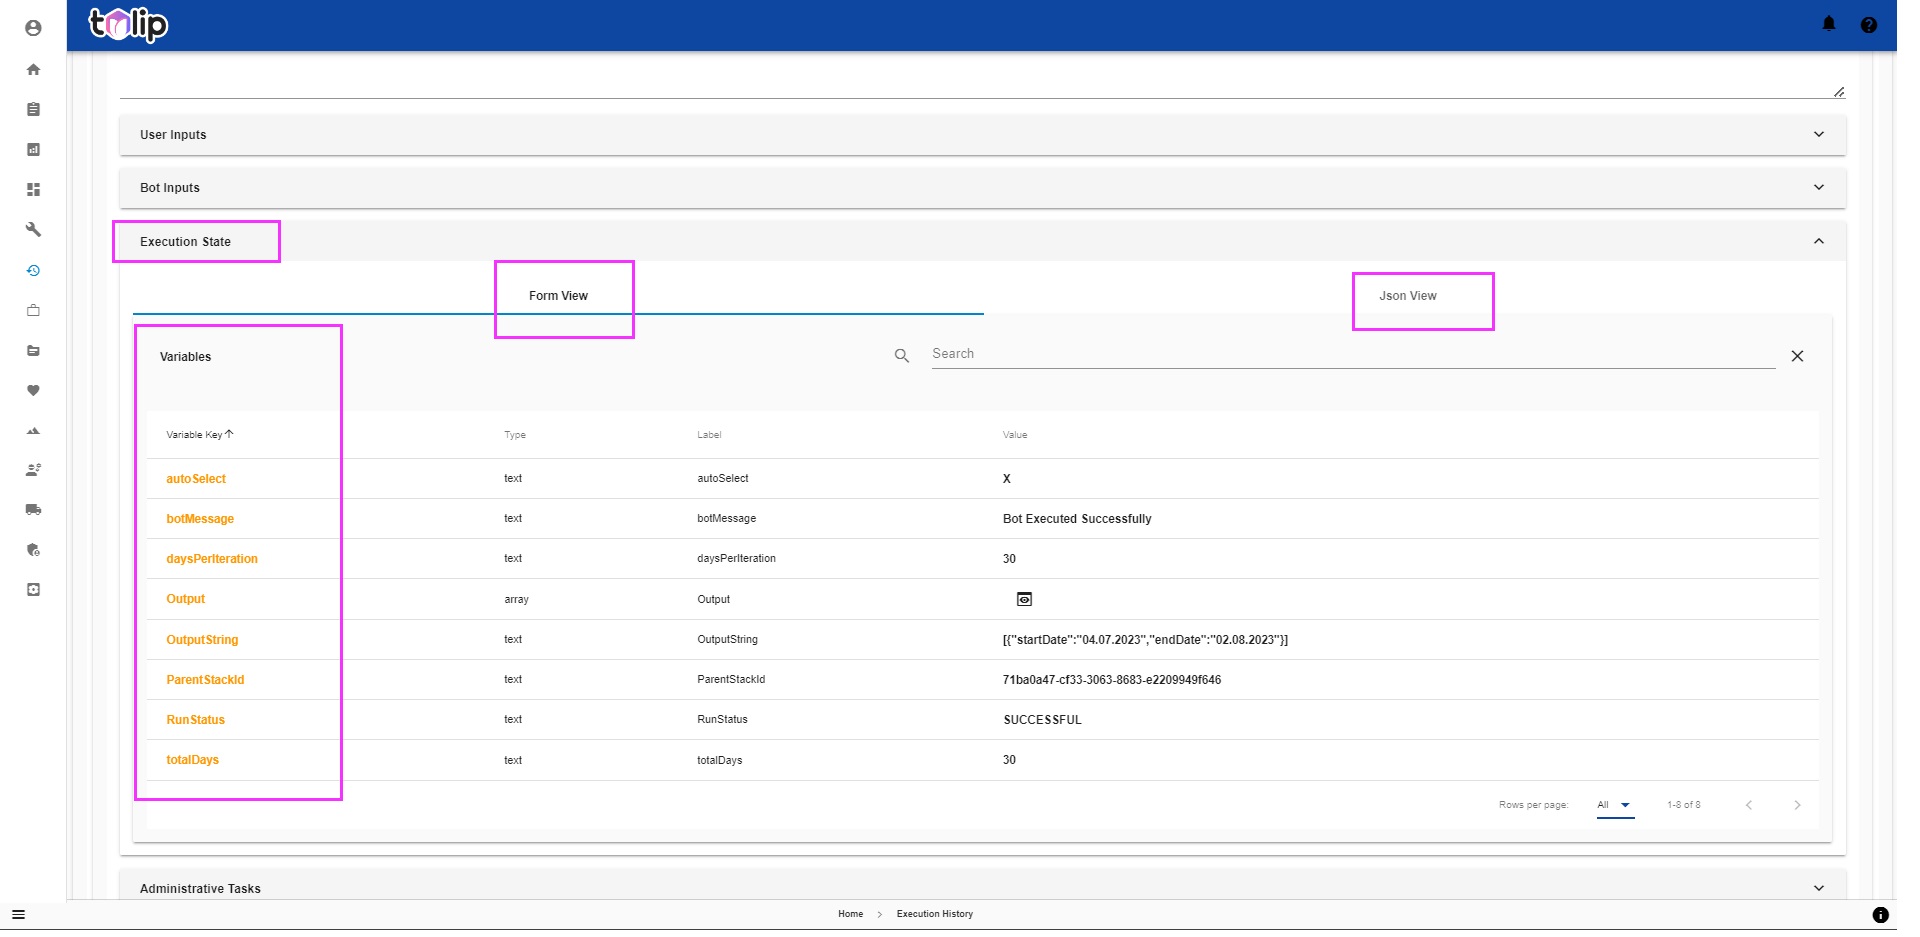
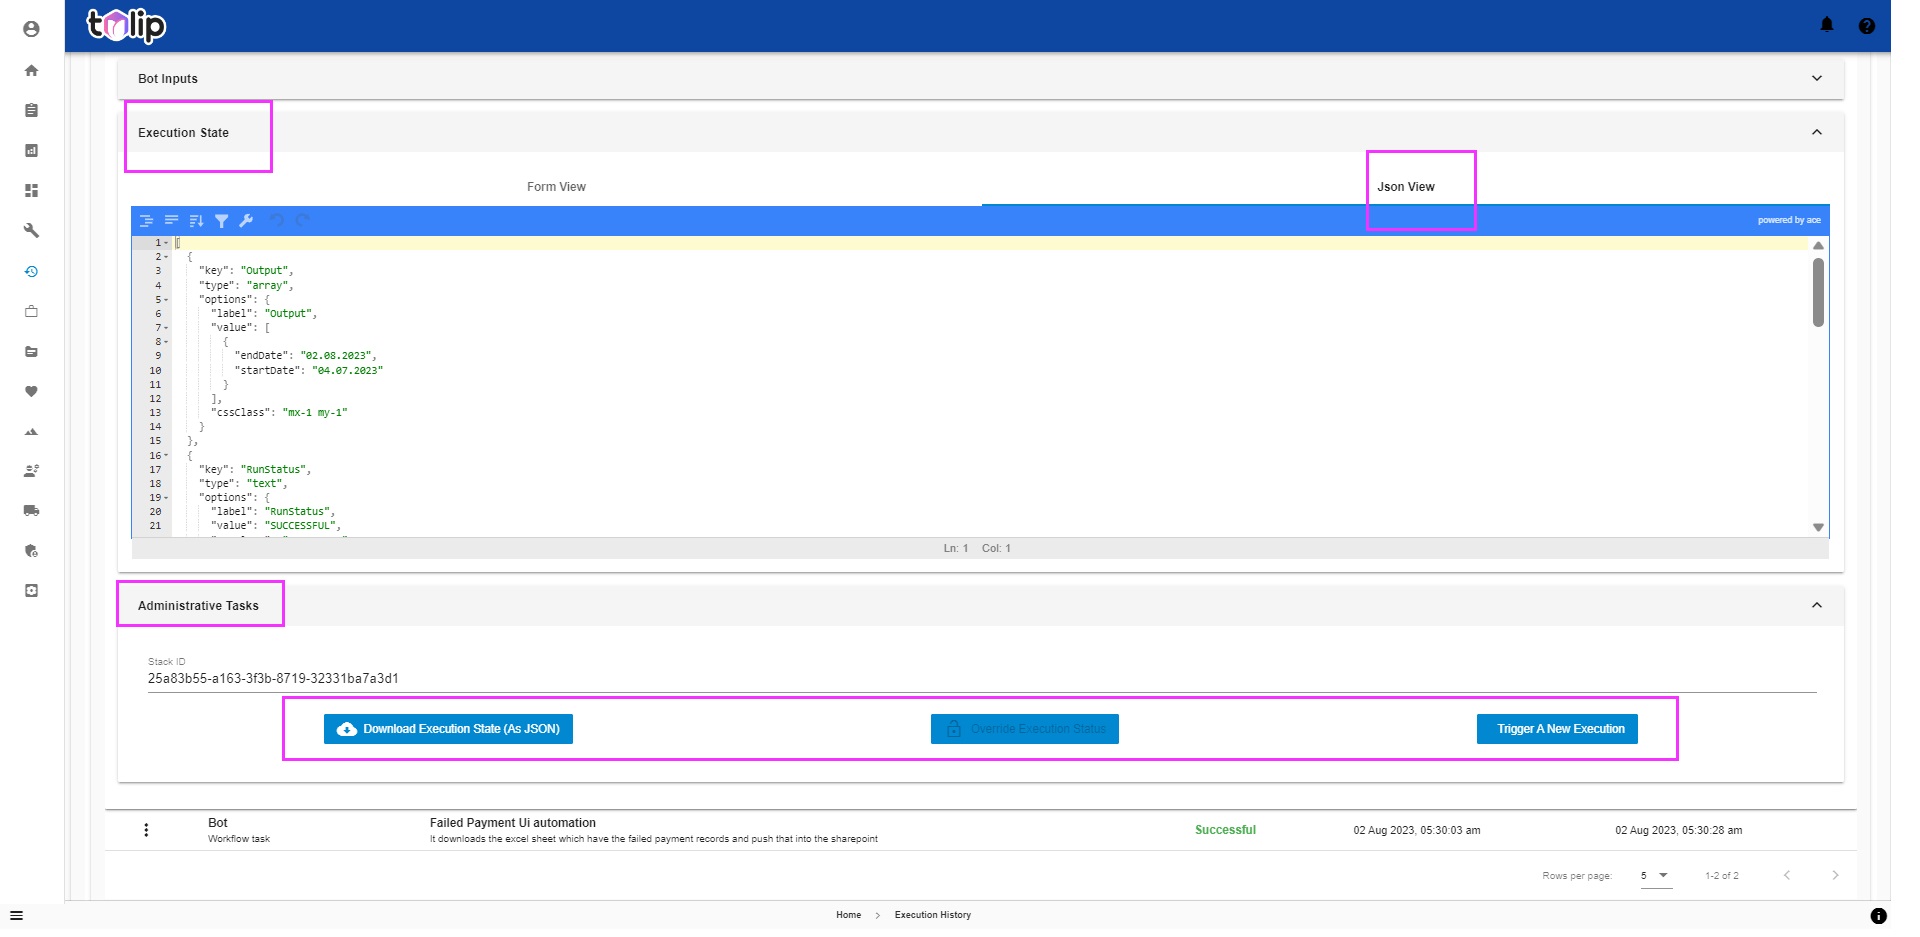
Next comes the Execution State. Again you have form and json views. This is like the output generated as a result of that particular bot's execution. You will find different variables populated with values.
The last is the Administrative Tasks. This is where you can control the actions on the bot. To know in detail, click here.
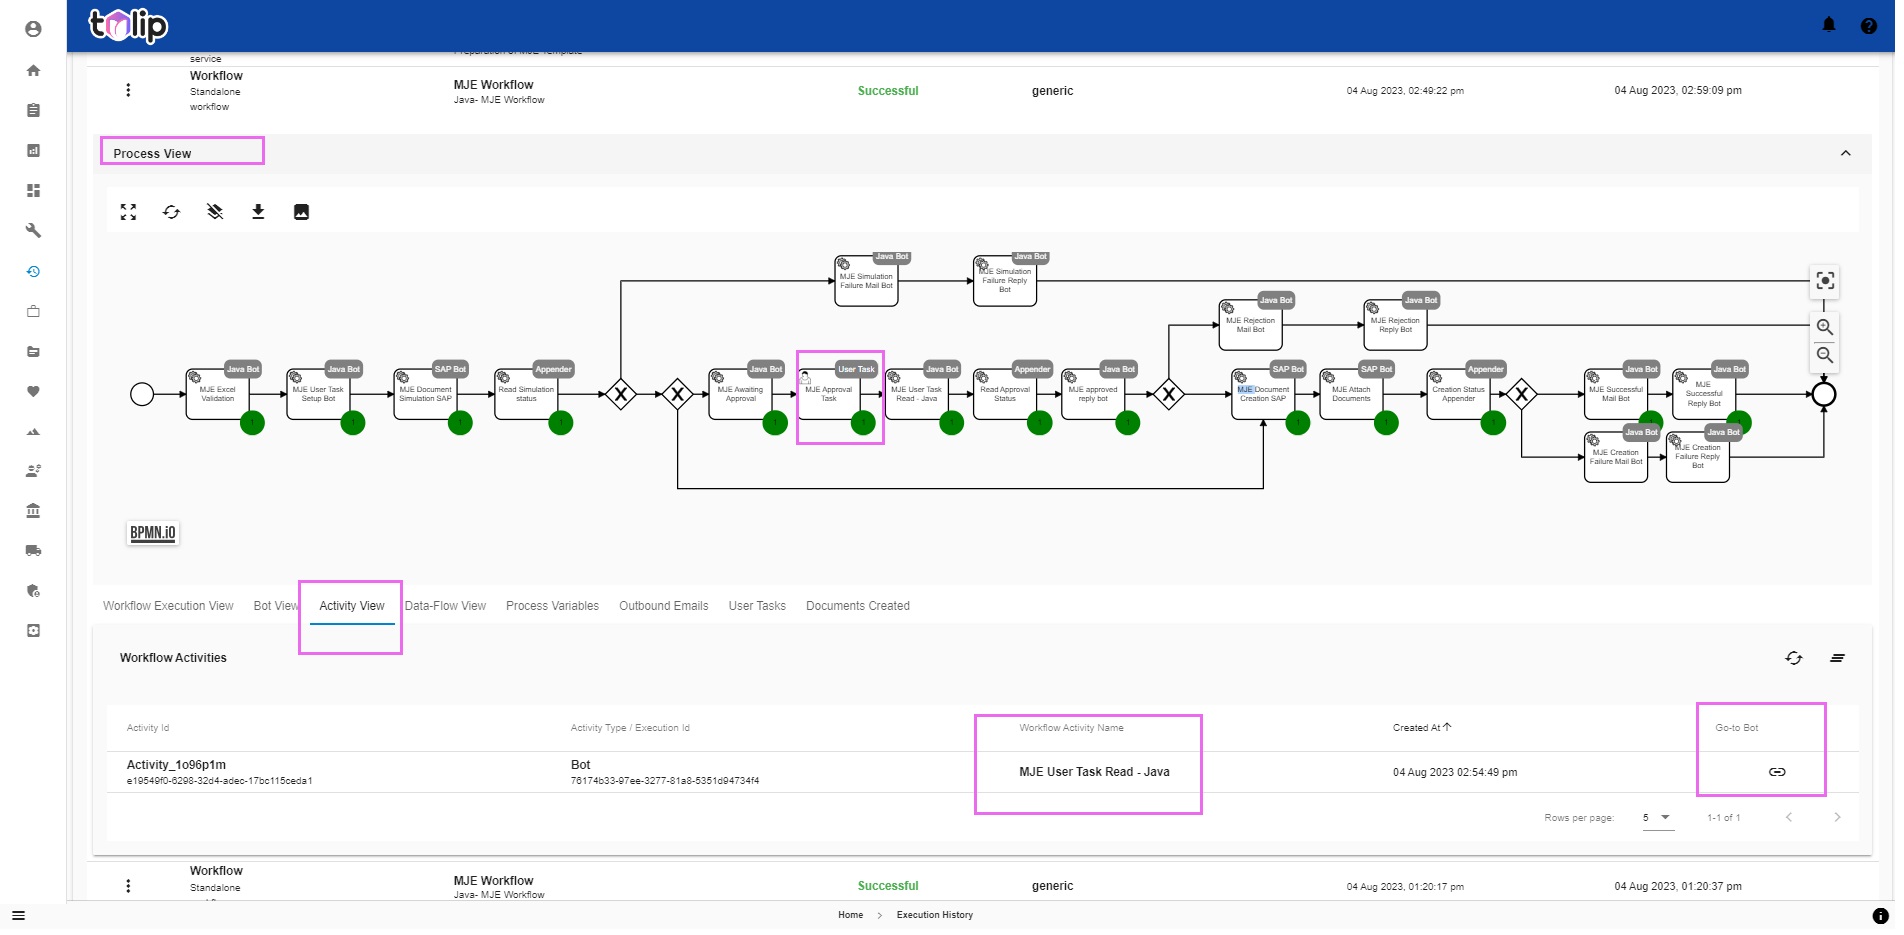
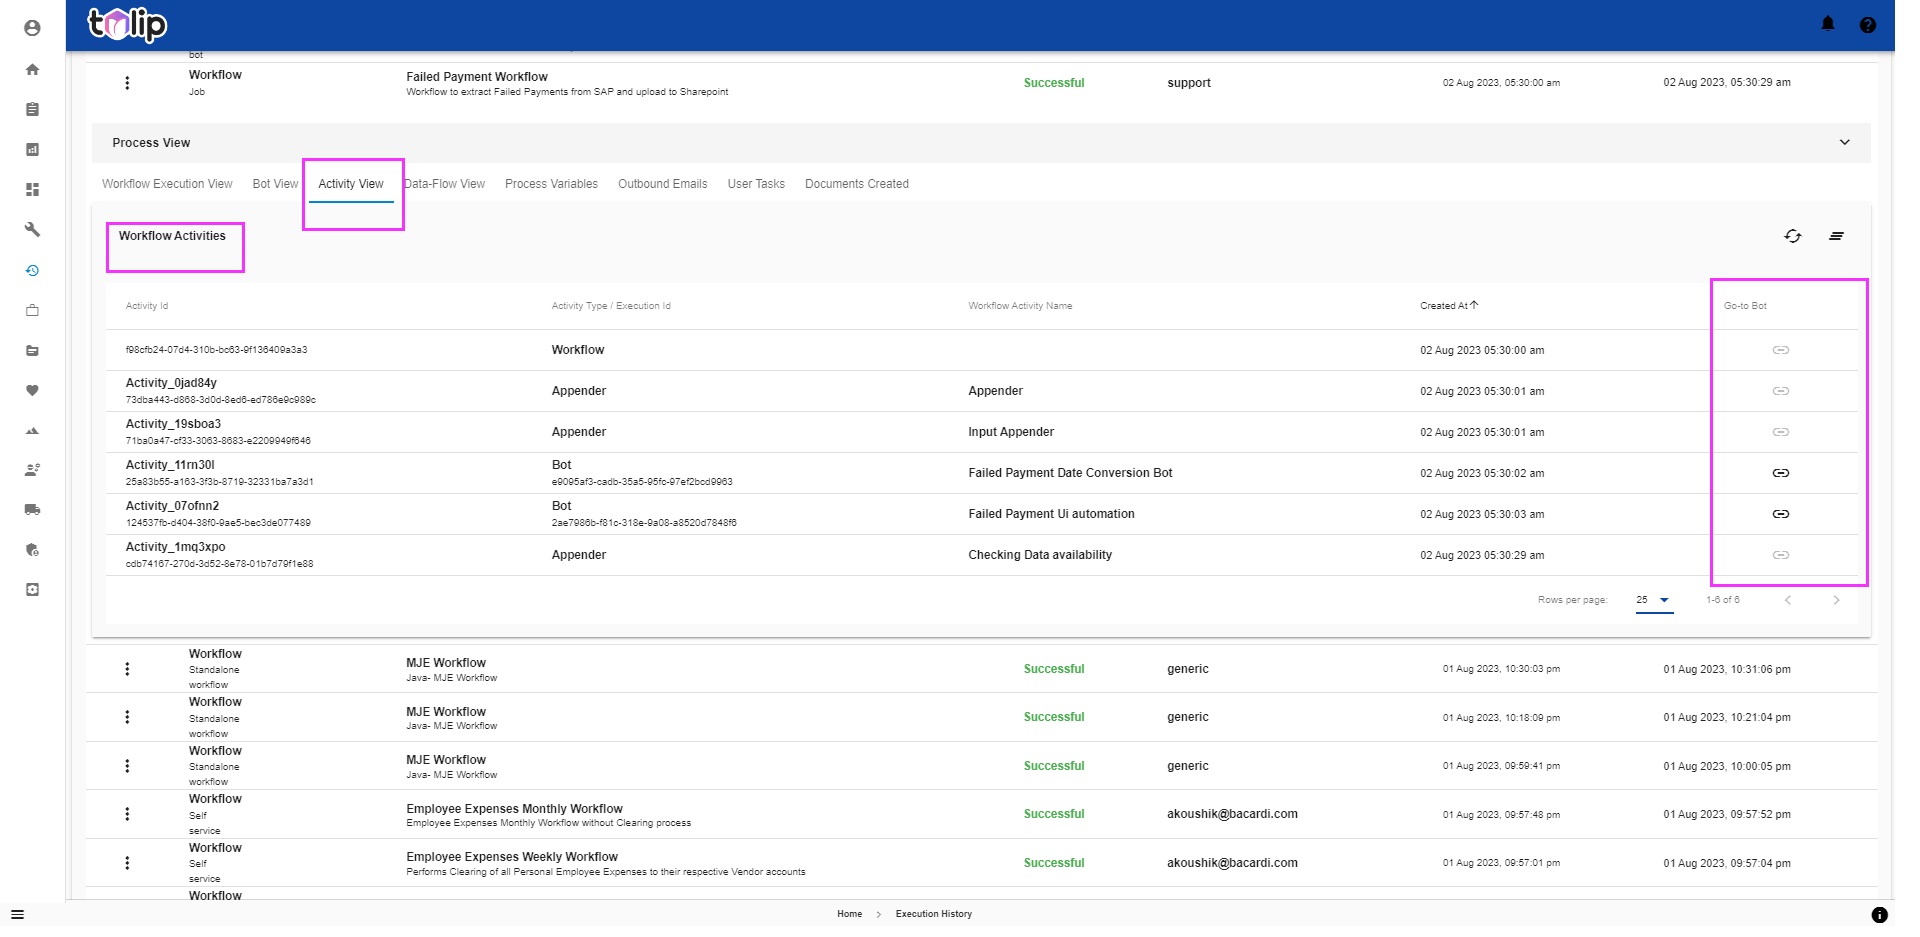
# Activity View
Here is where you can look at all the different activities as part of the execution. By activities, bot actions, tasks, appenders, etc are included. You have a link to "Go-to Bot" at every bot activity in this list. Clicking on any would take you to the Bot View with that particular bot focussed.
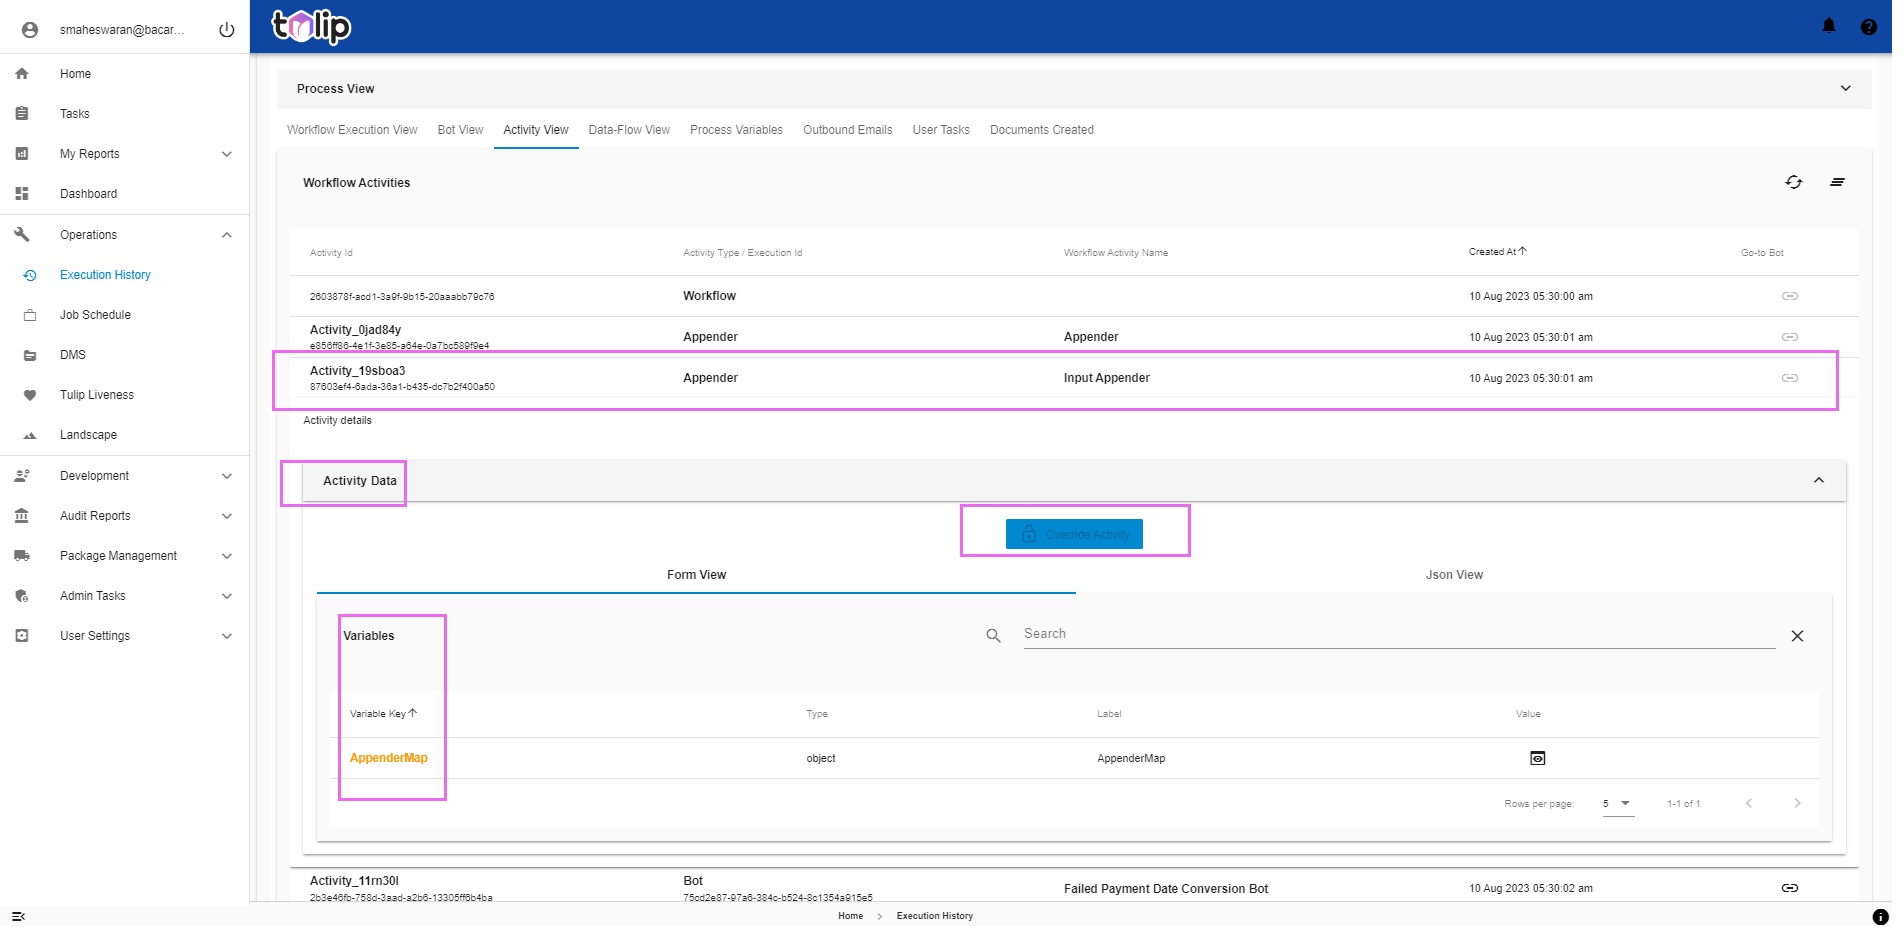
You can also choose to click on any of the activity. This expands up the Activity Data along with the variables viewable in form and json view. You also have an option to "Override Activity". This is applicable only when the execution is in progress and the execution is currently running at that particular activity and for some reason, you wish to override that activity. Please be aware that you must have the proper roles and relevant privileges for the same.
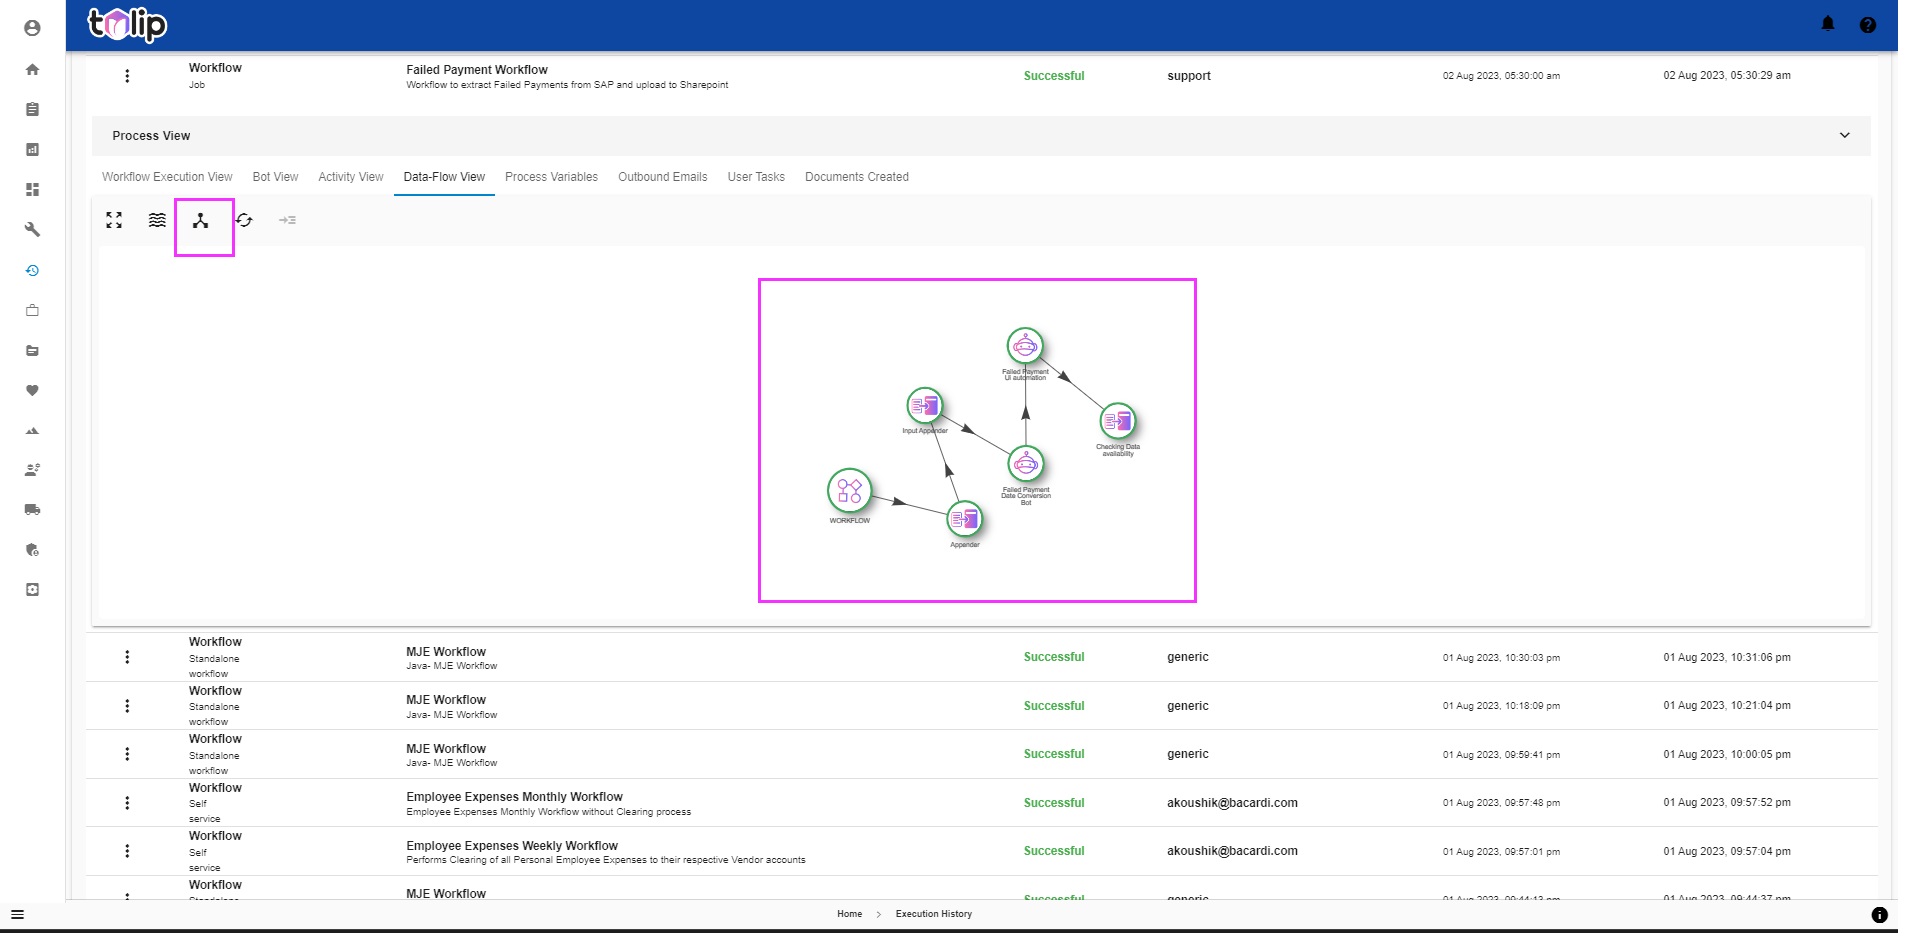
# Data-Flow View
This is an interesting view where you can identify the path of flow of data in the course of an execution. You can play around with the icons to see what each does.
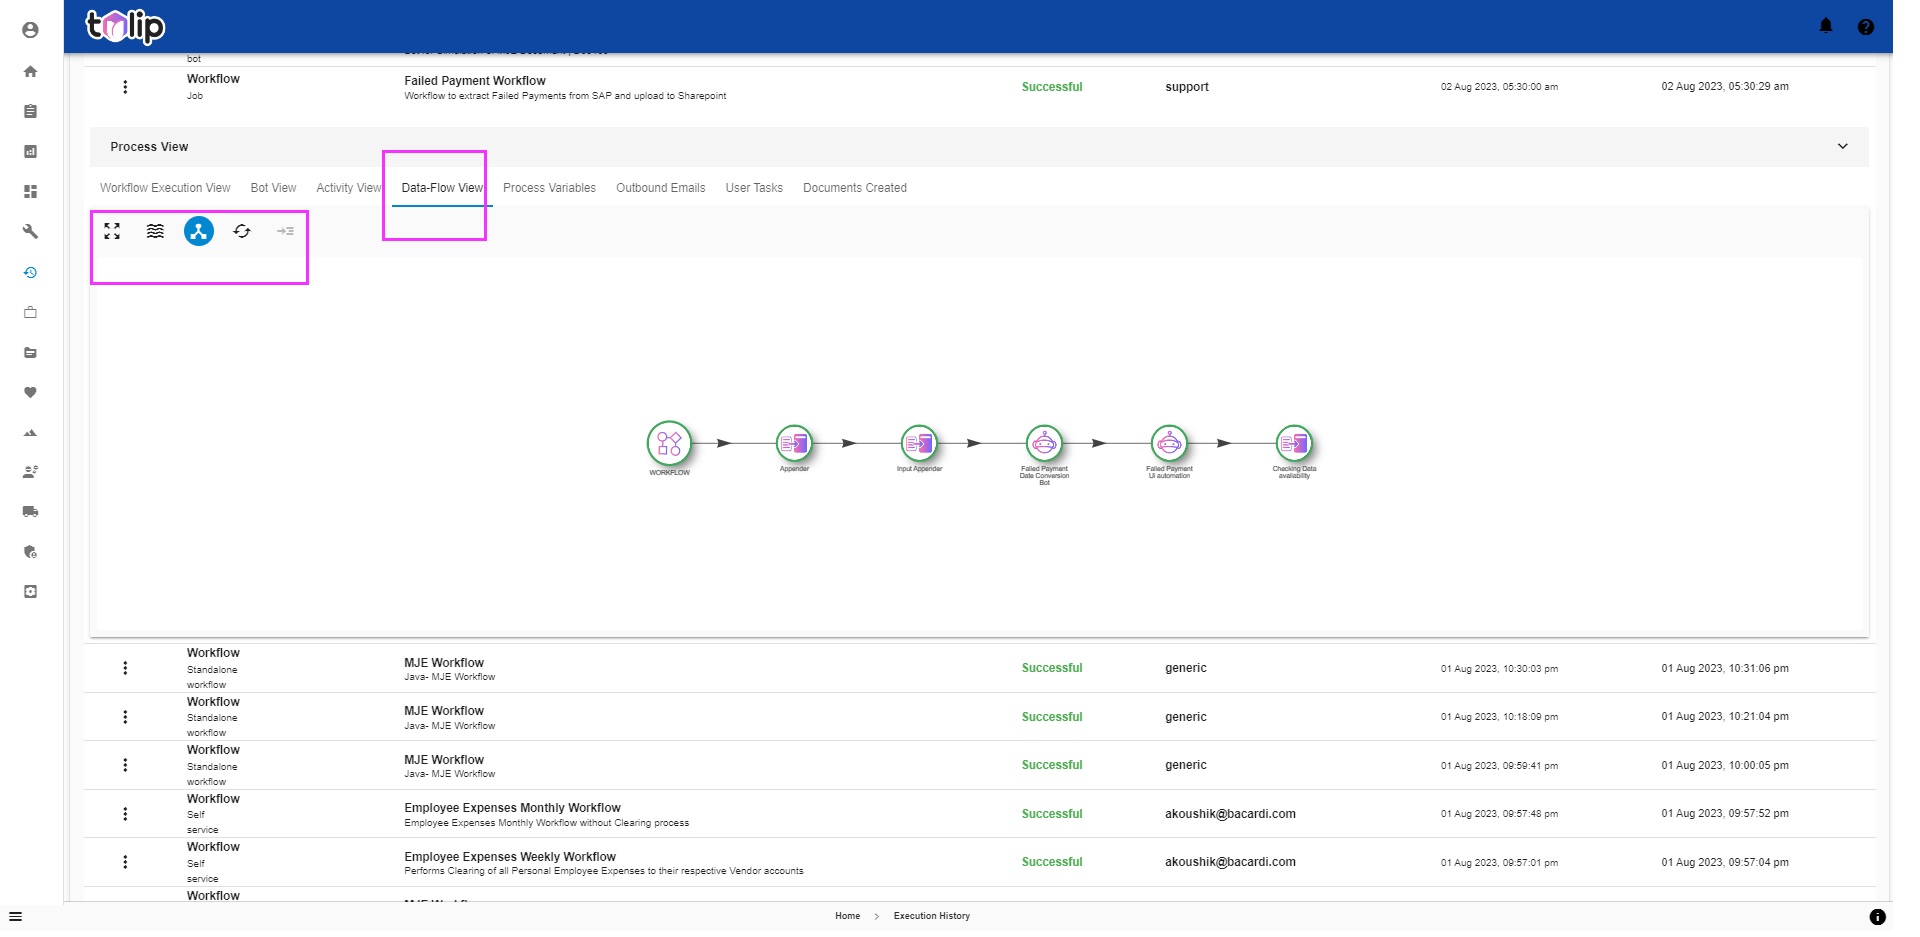
There are options to Toggle the view for physical interactions between the activities or the hub as a whole.
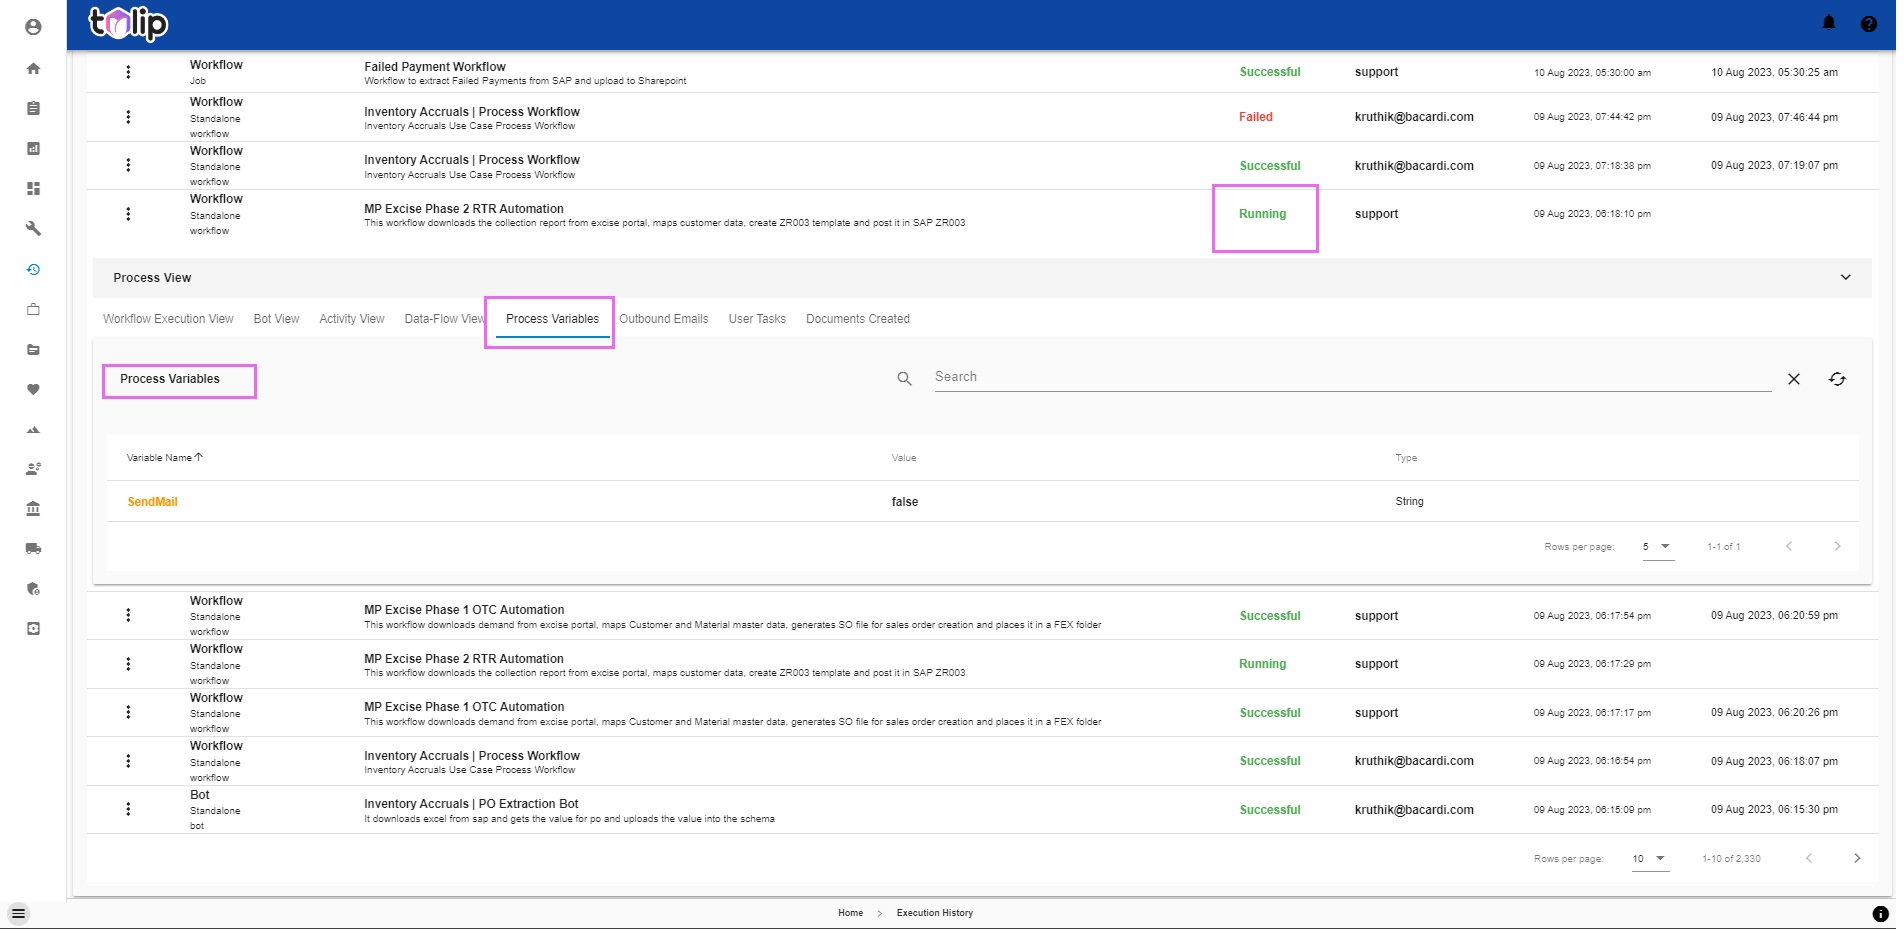
# Process Variables
Any workflow that is currently in Running status would only have this Process Variables. This just holds the variables that are created intermediately in the due course of execution. The variables loose their scope once the execution completes. This is very useful when any execution is stuck in Running status for a long time. The DevOps Lead can easily analyze the reason for this by looking at the Process variables. Or they can use this as test data to recreate the same issue in Quality system.
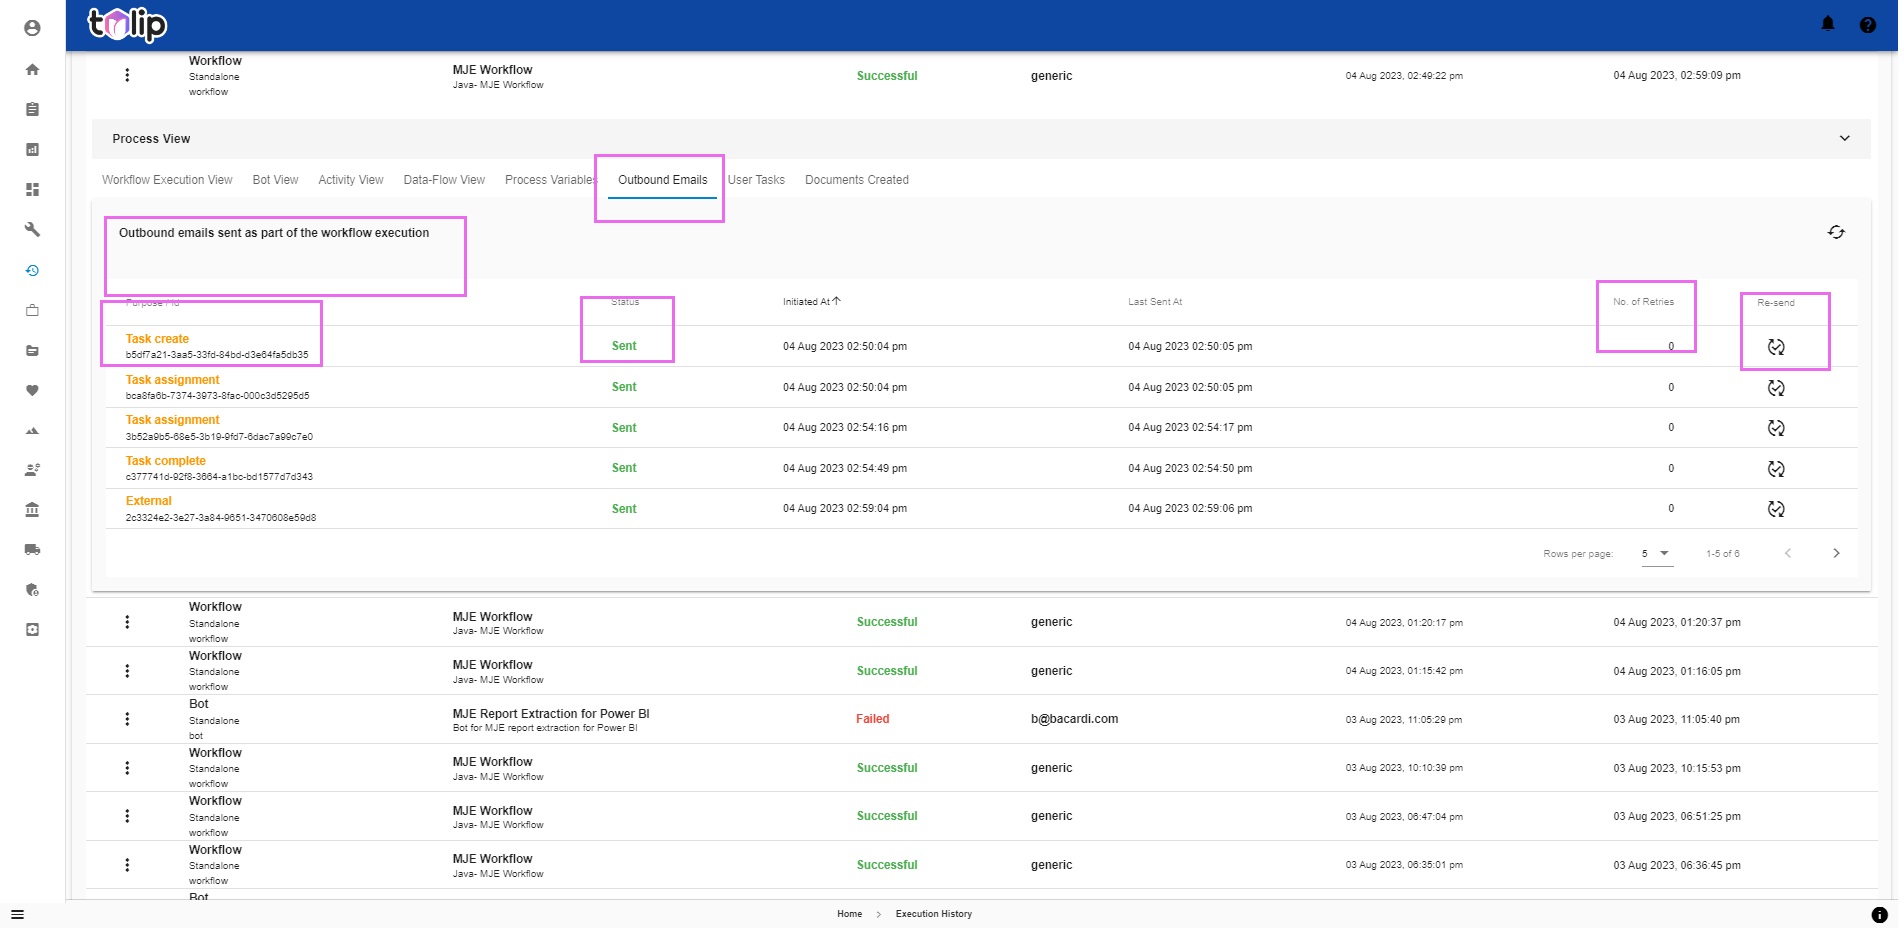
# Outbound Emails
As with Automation Services, under Automation Requests, how users can view the emails generated as part of the request, here you can view the Outbound emails generated by that particular execution. You can view the status, you can re-send any number of times as you wish and also track the number of retries. This gains prominence during scenarios where Tulip sends out the emails but due to problems in Microsoft's email server, emails may get delayed or in worst case, lost. So, you can always retrigger the emails alone without the need for retriggering the entire execution.
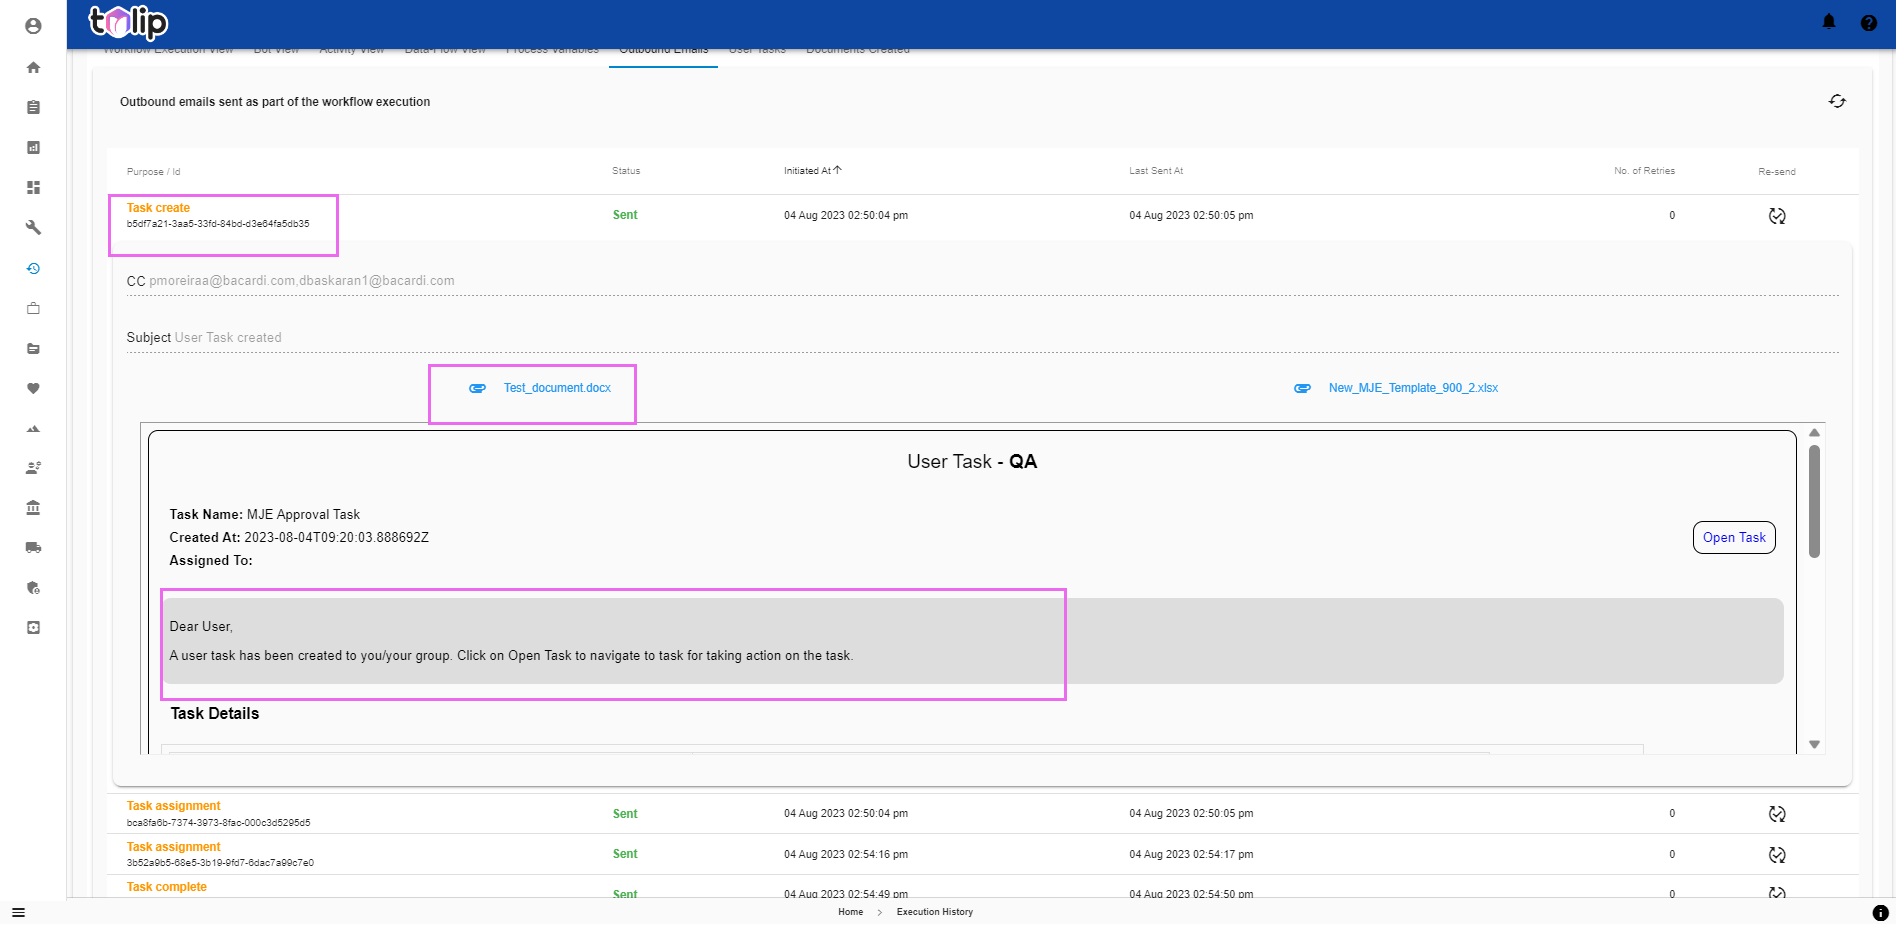
Clicking on any, you can view the replica of the email along with the intended recipients and the subject. You can also view the attachments. What more, you can also download the attachments by just clicking on them.
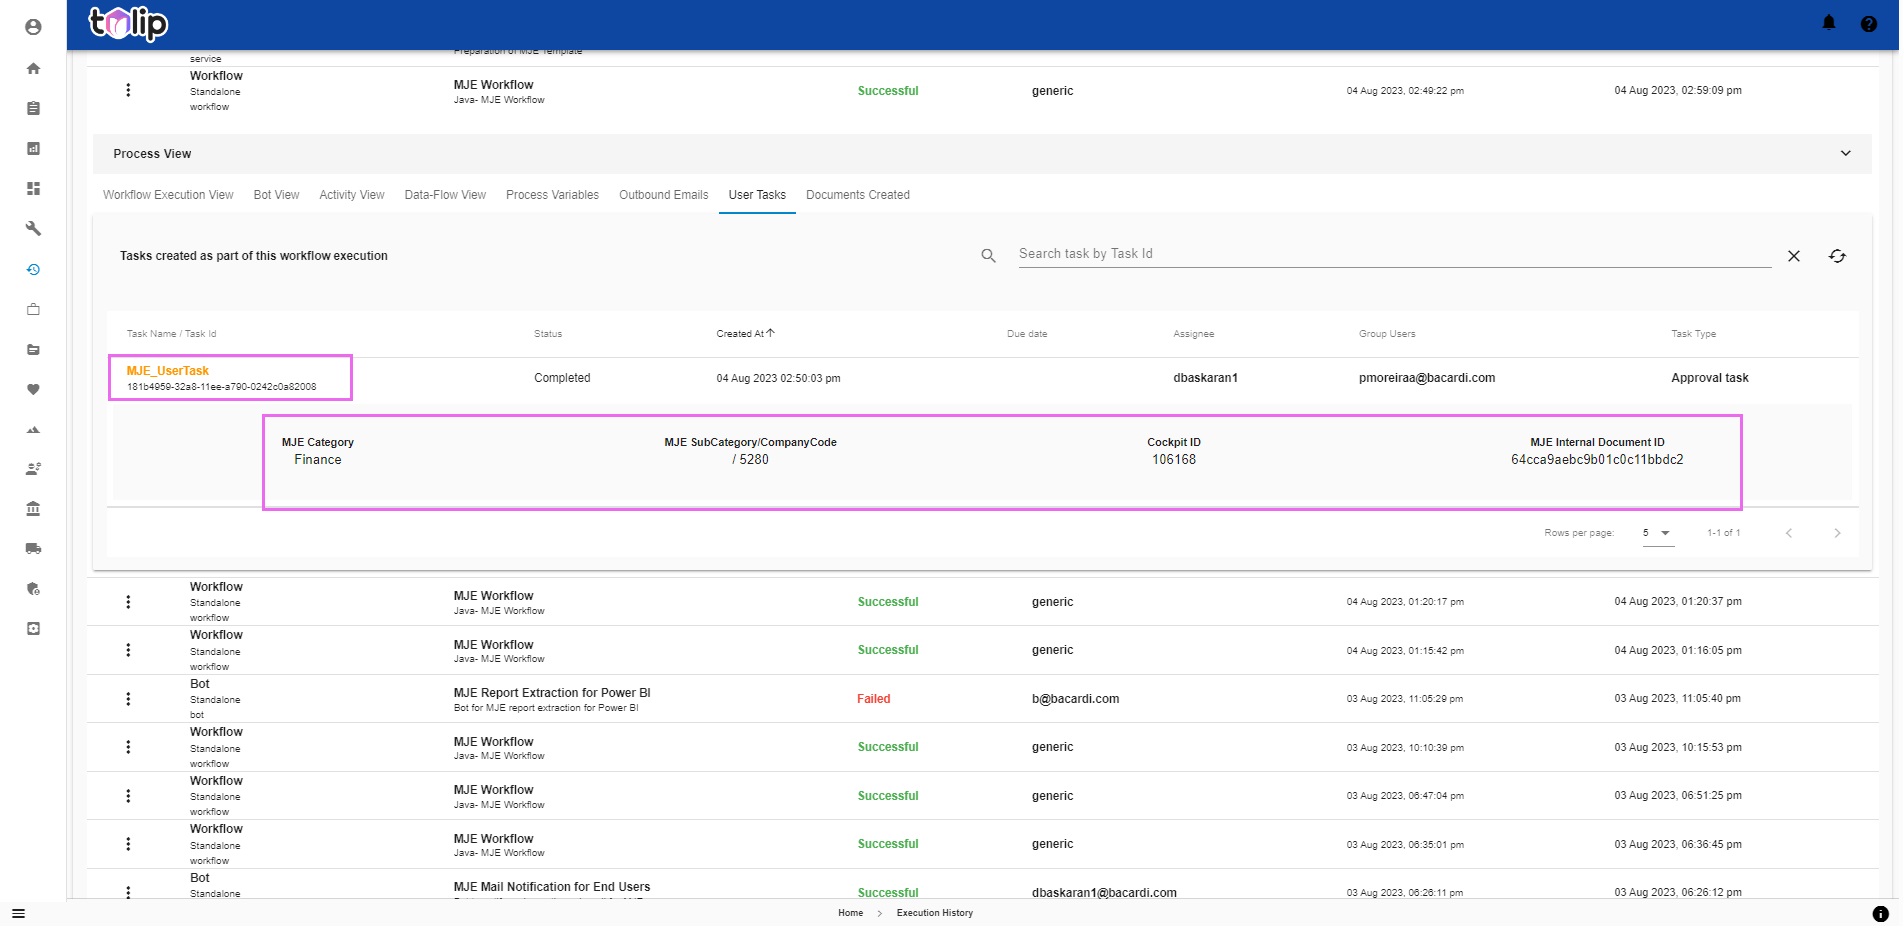
# User Tasks
Again, as with Automation Services, you can also view the User Tasks created as part of the workflow execution. This includes both User Input Tasks and Approval Tasks. You can now easily view the Tasks created, the status of the tasks, the Assignee and the Group Users to whome the task can be assigned.
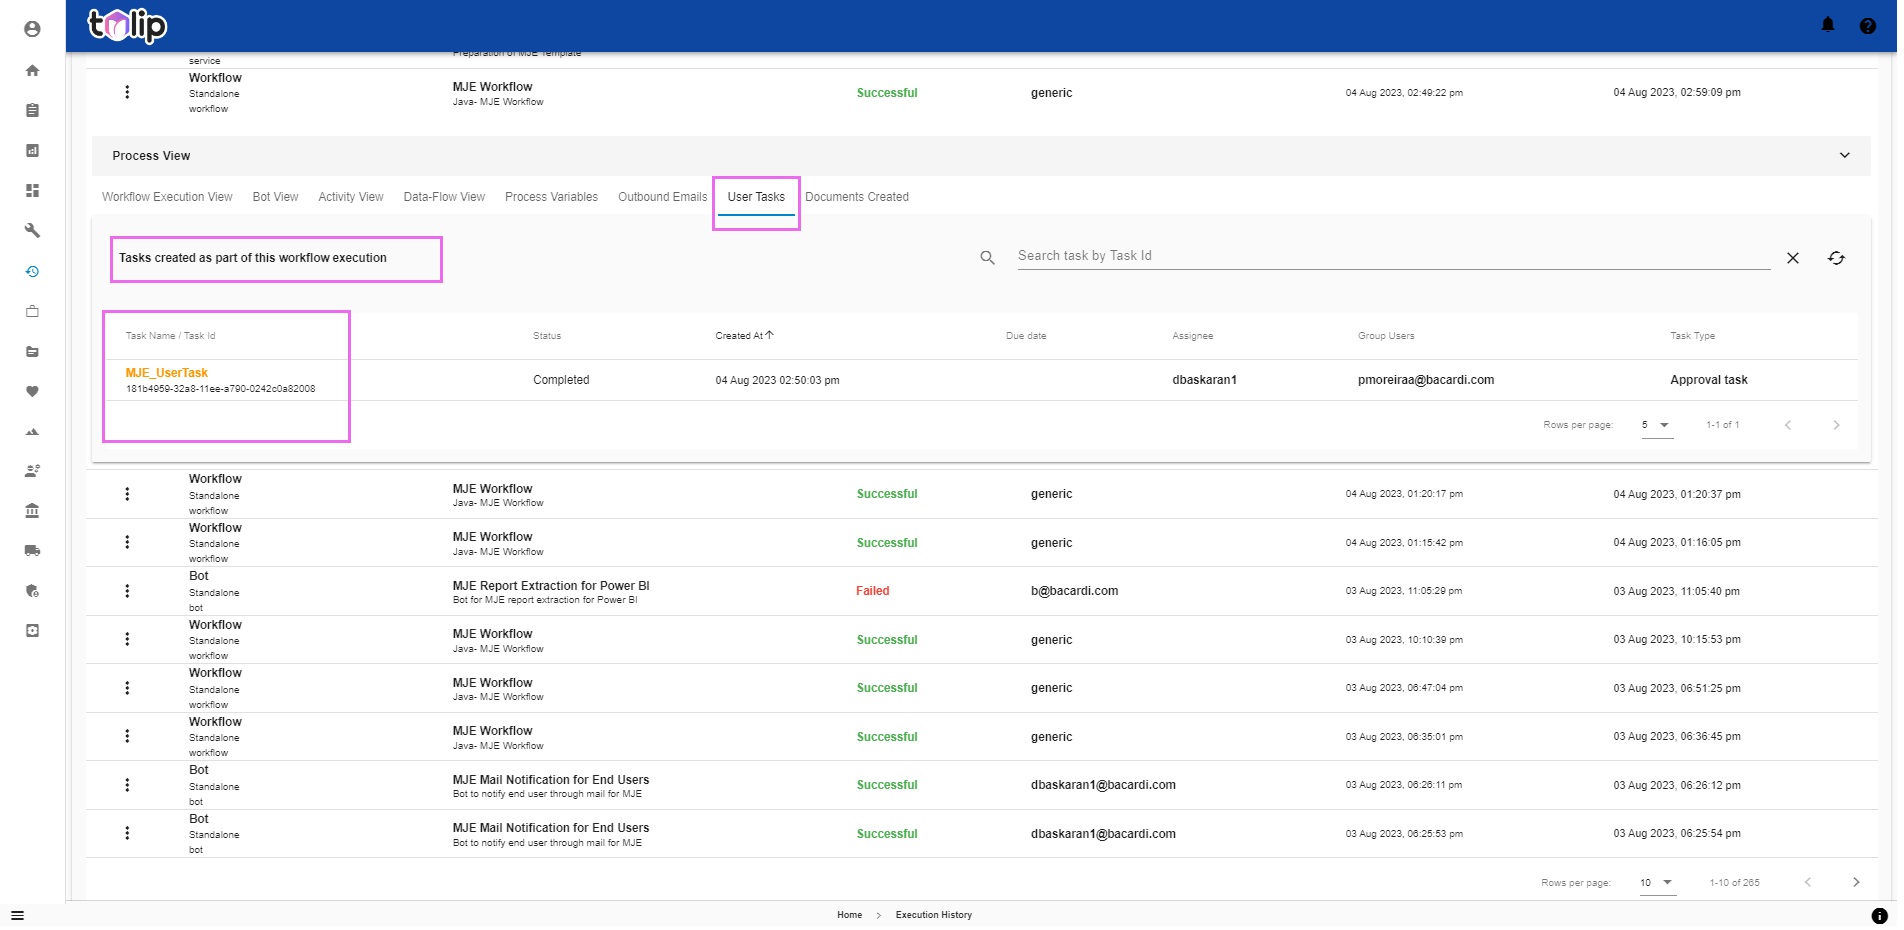
Clicking on any of the Task, you can view the other intricacies of the details.
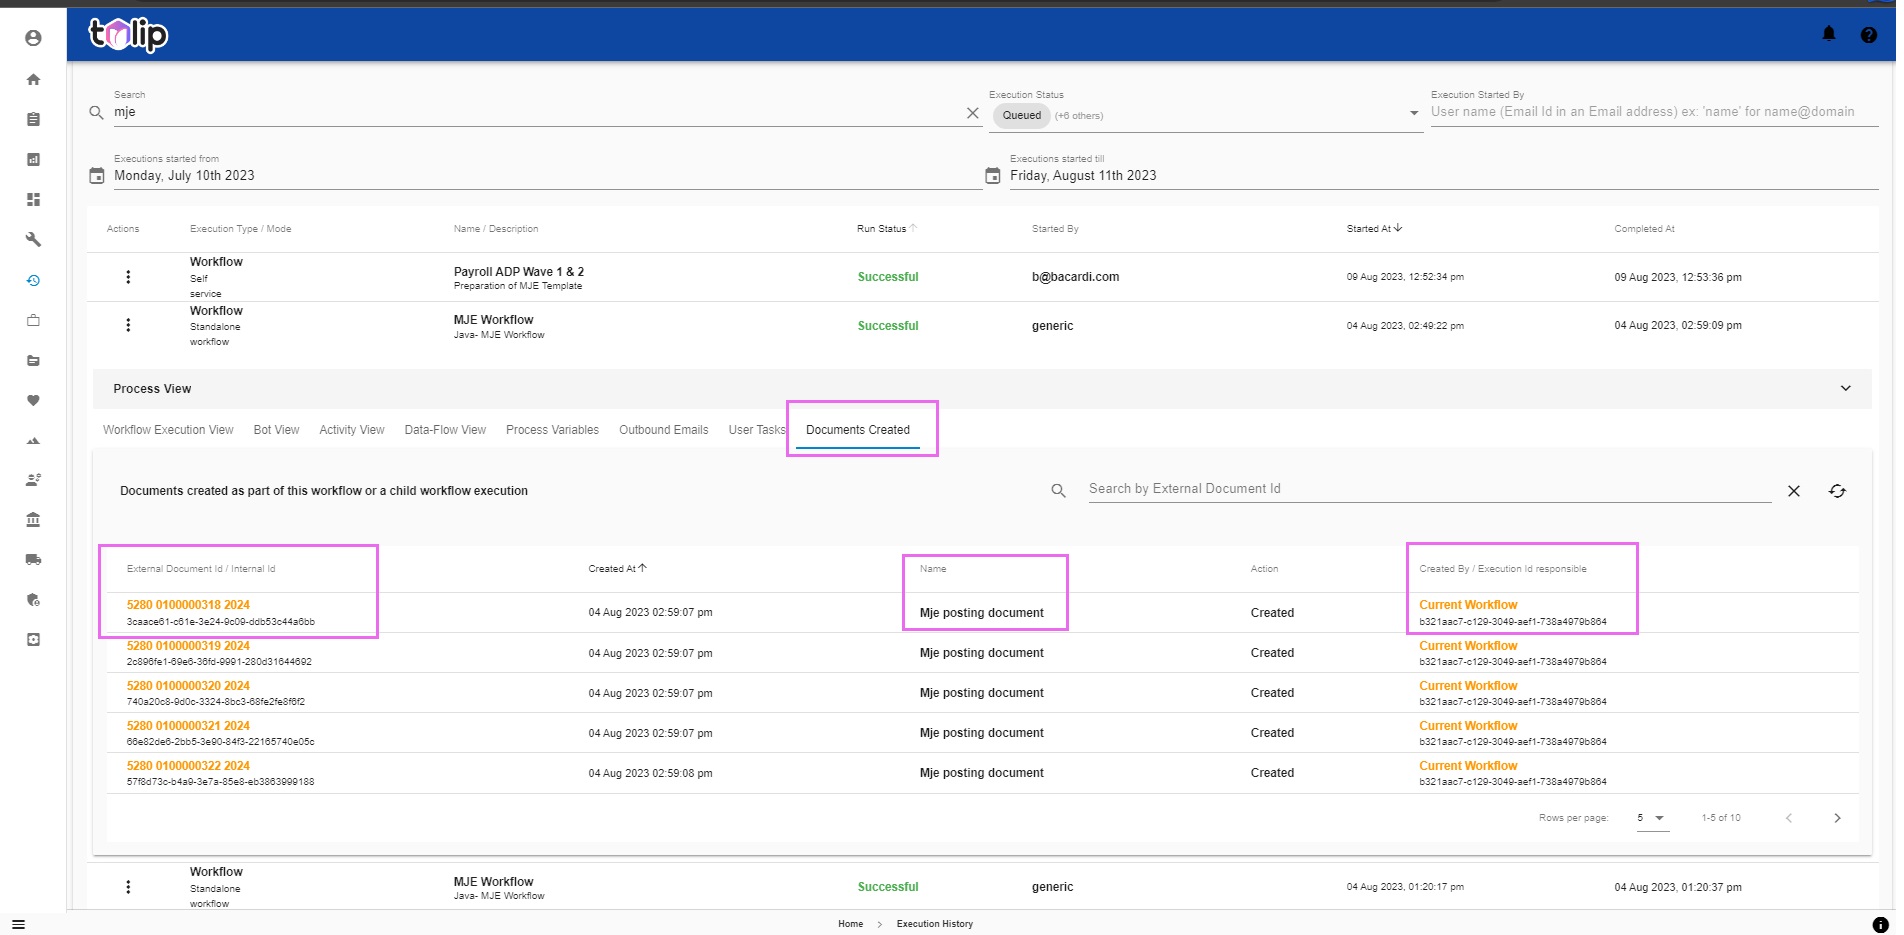
# Documents Created
This version of Tulip brings upon an unique feature with this section. Here is where you can view the Documents created as part of this execution if it is a stand-alone workflow, or even part of its children workflows if it is a parent workflow. By documents, anything with a valid identifier ex: Accounting documents, Clearing documents, POs, SOs, etc. is included. This would enable you to know what is the output of any execution.